Dashboards provide a real-time visual representation of your data. Visual representations can be displayed as charts or data.
Prerequisites
Before a dashboard can be created, the following steps must be completed:
Create a single query or compound report in Clinical Reports. Note that compound reports must be written to a CSV file named
result.csv.Verify, or have your admin verify, that the Available in dashboards toggle is on in Sharing.
A user must be assigned to the searchappliance_search_by_id role to access Dashboards.
Create Dashboard
Note:
Reports and queries must be shared before you open the Dashboards screen. If you open the page before sharing a report or query, it won’t appear until after the Dashboards page is reopened.
Visualizations are customizable representations of data and are mostly charts and graphs. However, text visualizations are available. These are useful if you want to display the number of records that match the criteria.
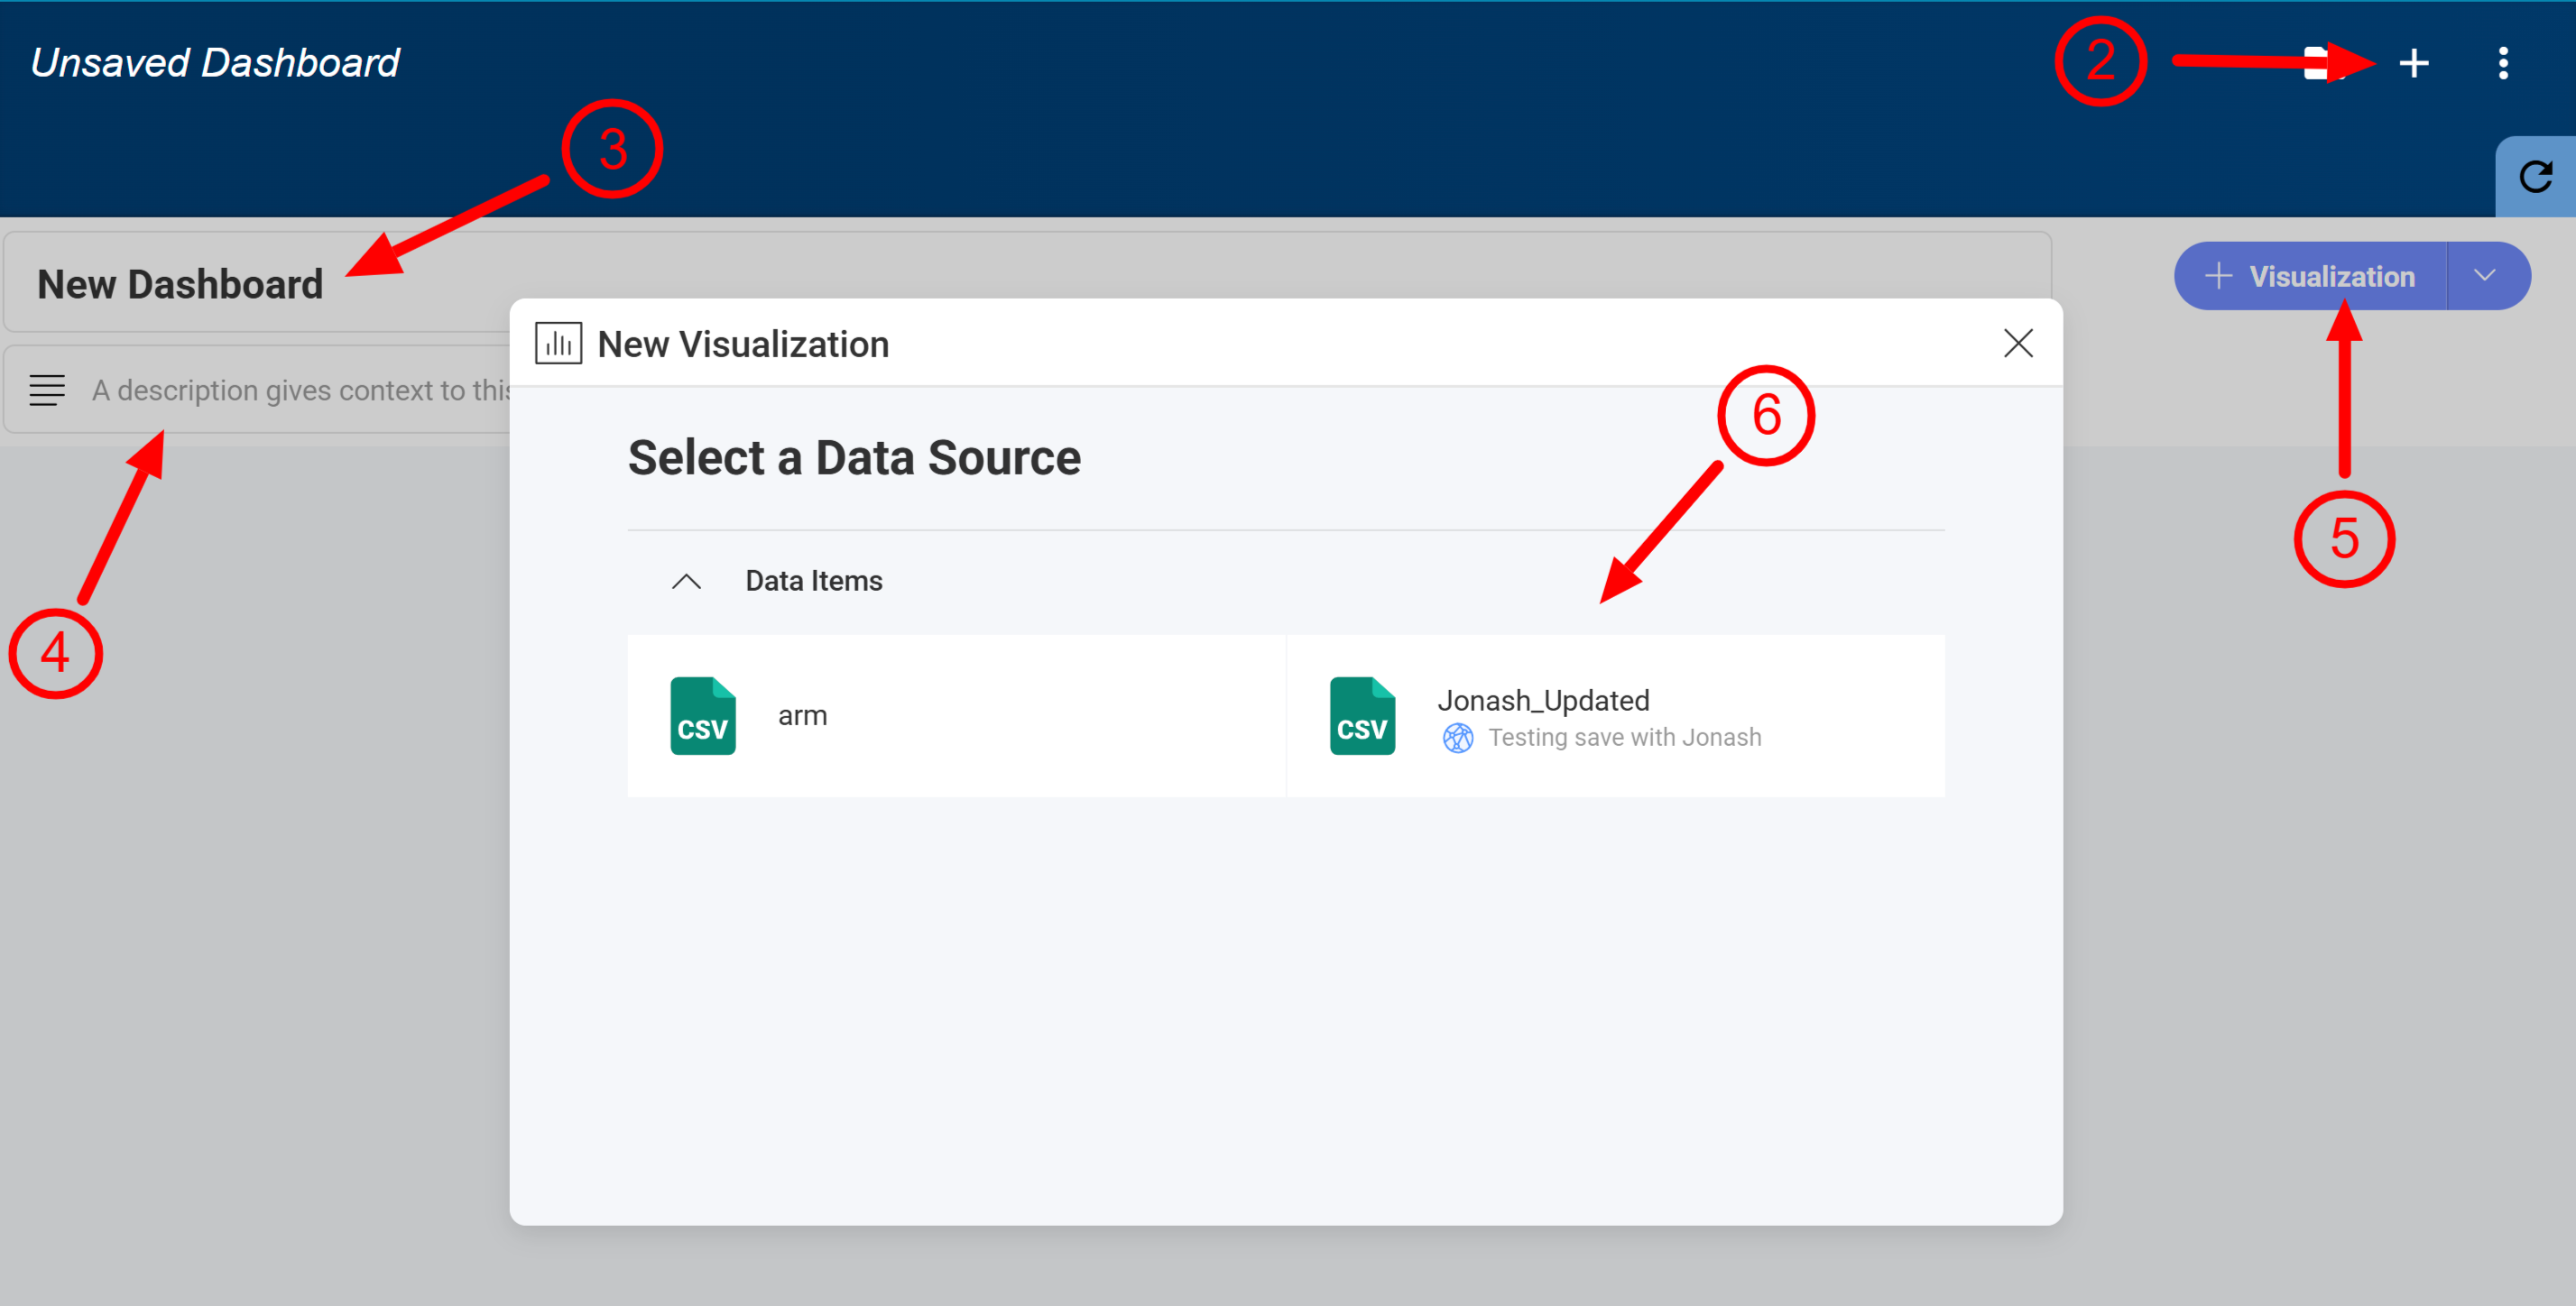 Click on the image to zoom.
To create a dashboard and add a visualization, follow these steps:
Go to Dashboards.
Click if New Dashboard is not already displayed. By default, navigating to Dashboards lands on a new dashboard screen.
Give it a name.
Give it a description if needed.
Click to add a report.
Choose your report or query from the available options.
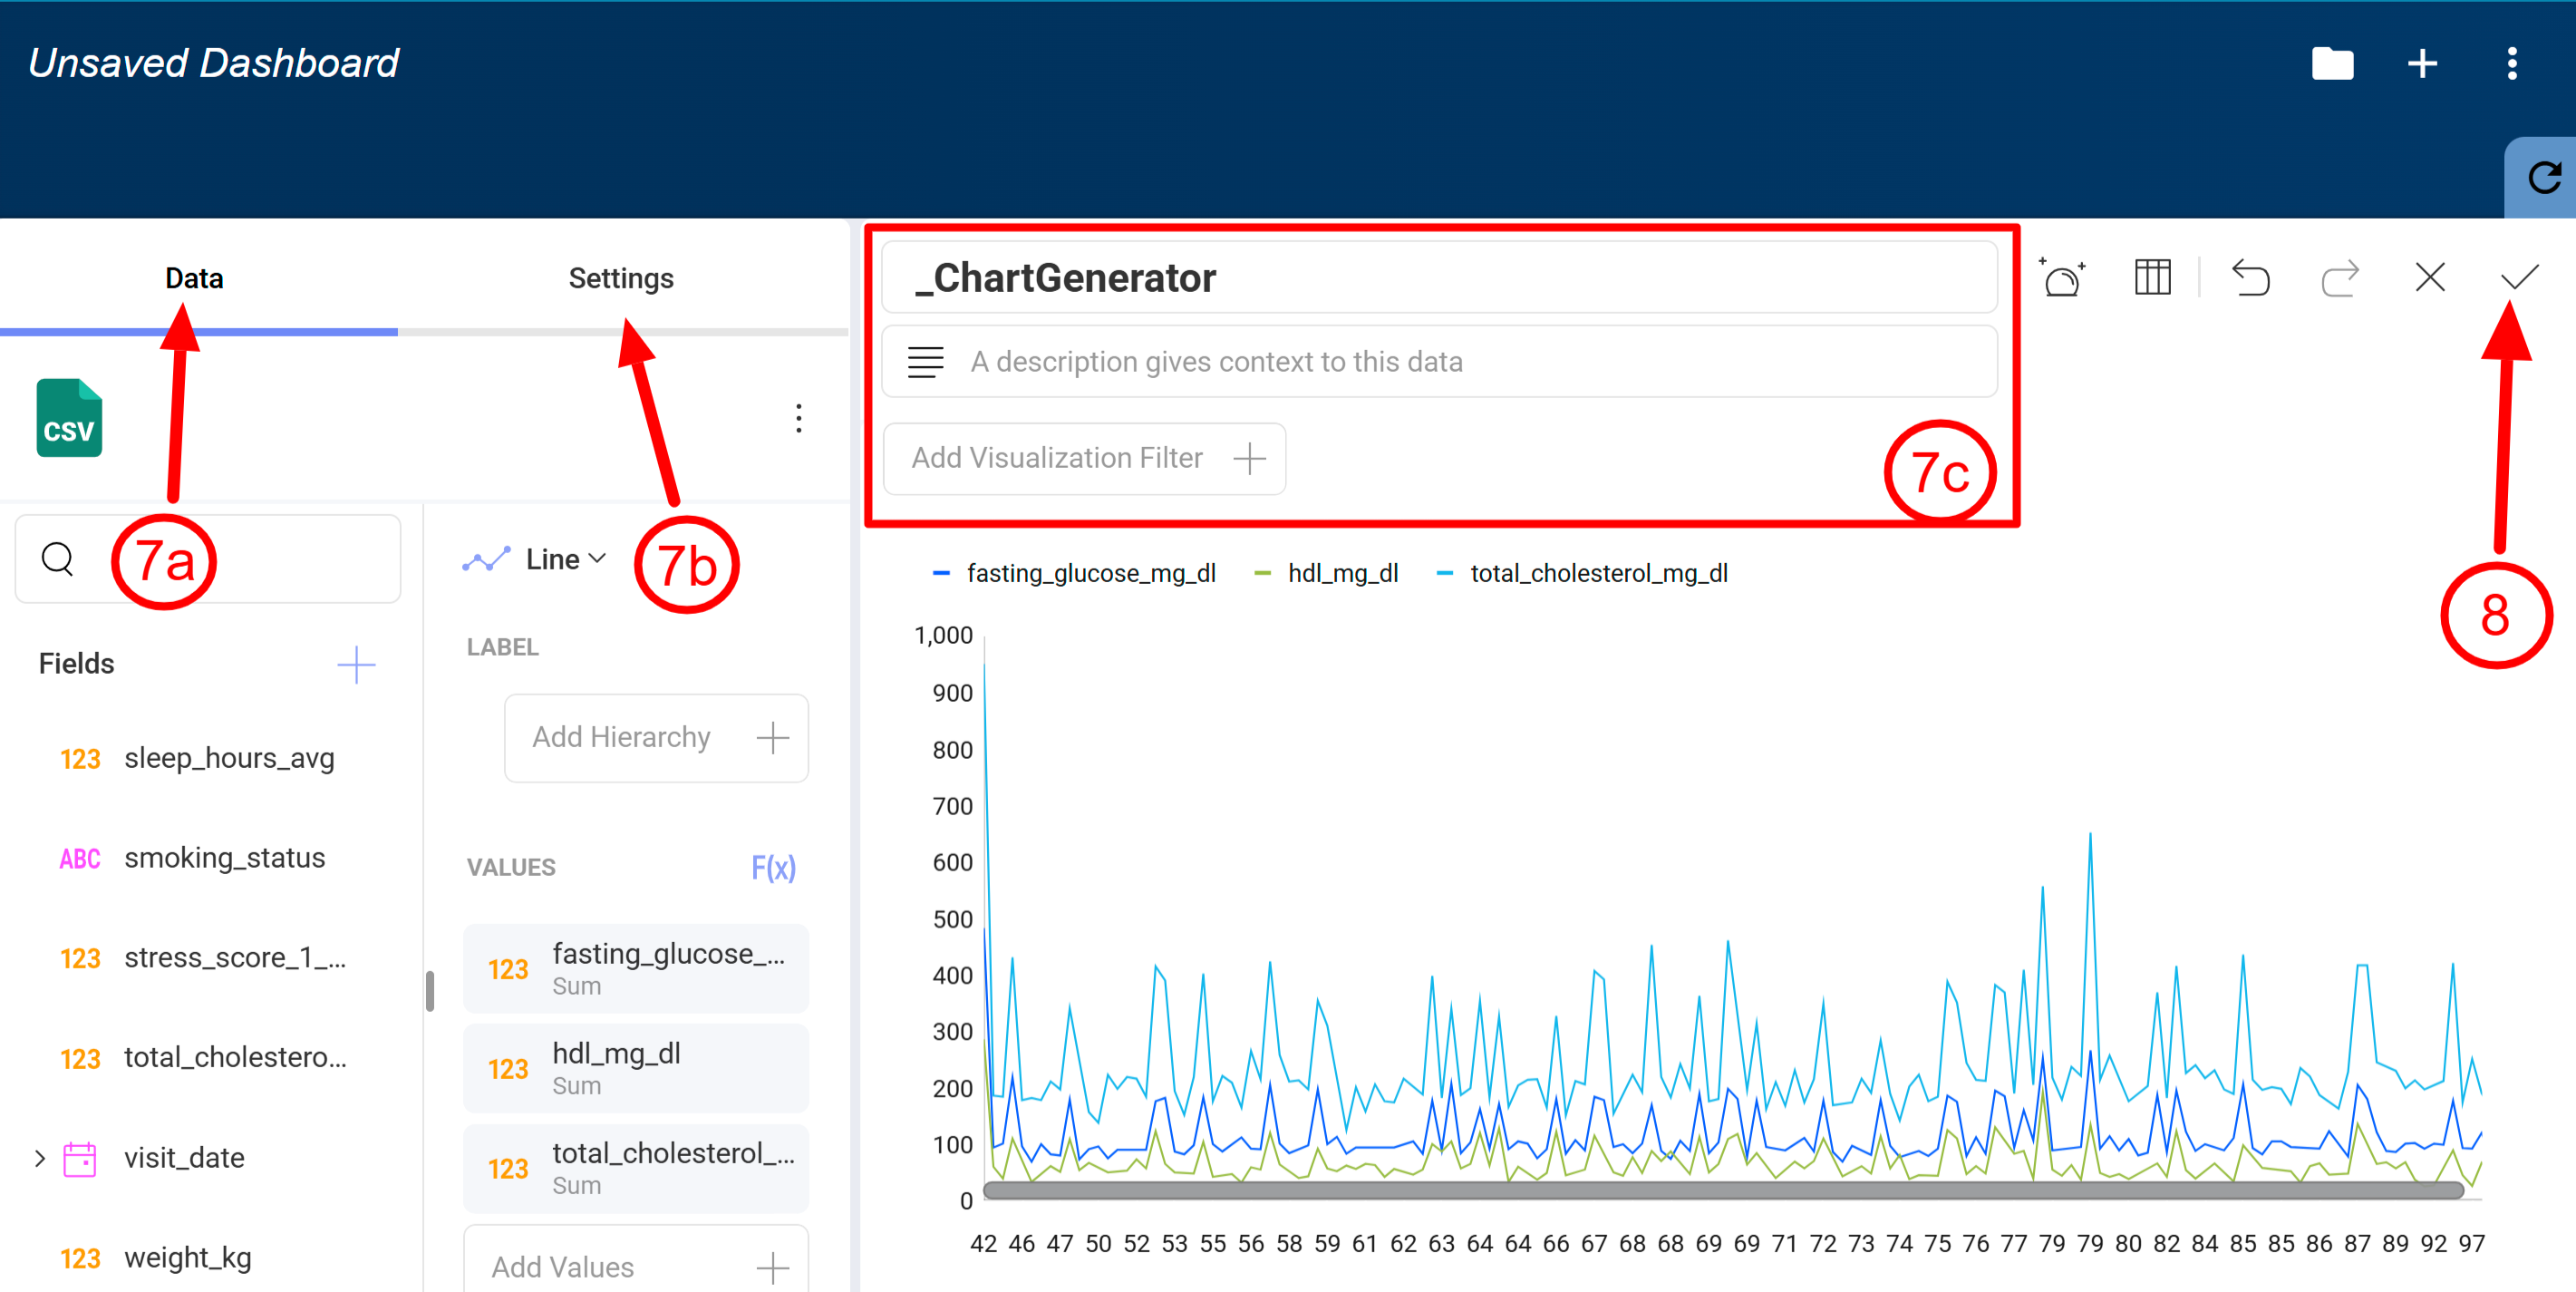 Click on the image to zoom.
Configure the chart. Click
 to toggle between chart and data view.
Data tab (the options change depending on the chart type chosen). Click to open a drop-down of the fields or drag and drop them from the column on the left.
Choose the chart type
Choose the label
Choose the values
Choose a category (optional)
Add fixed lines (optional)
Add a data filter (optional)
Settings tab:
Adjust colors (optional)
Adjust axis settings (optional)
Visualization:
Change the name* (optional)
Add a visualization description (optional)
Add a visualization filter (optional)
Click to save the visualization.
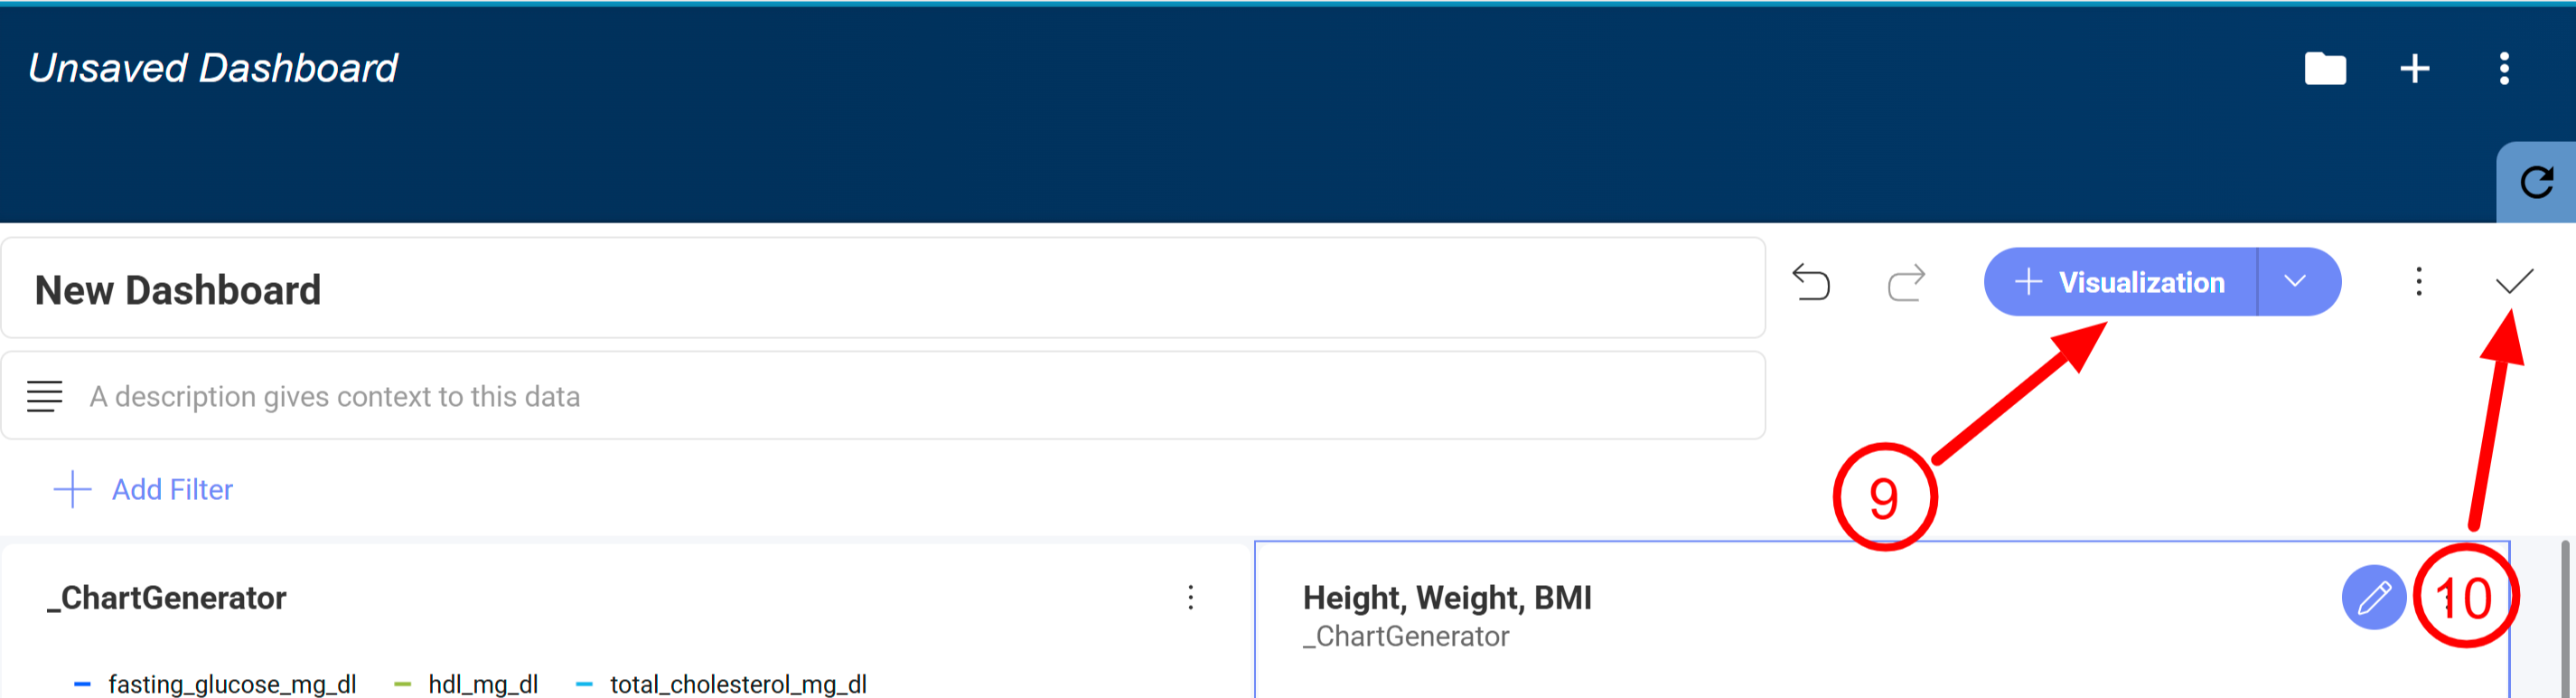 Click on the image to zoom.
Click to add a new visualization.
Click to save and close the dashboard or to cancel without saving.
Select Fields
The selected single query or compound report predetermines the available fields. Drag and drop the fields or click in the input field.
Format Fields
Format the visualization’s fields by clicking on the added field in the right column.
Arrange Visualizations
While still in dashboard-editing mode, you can arrange the visualizations by dragging and dropping them in the order you want.
Resize a chart by clicking the chart and dragging one of the sizing handles that appear around the visualization outline.
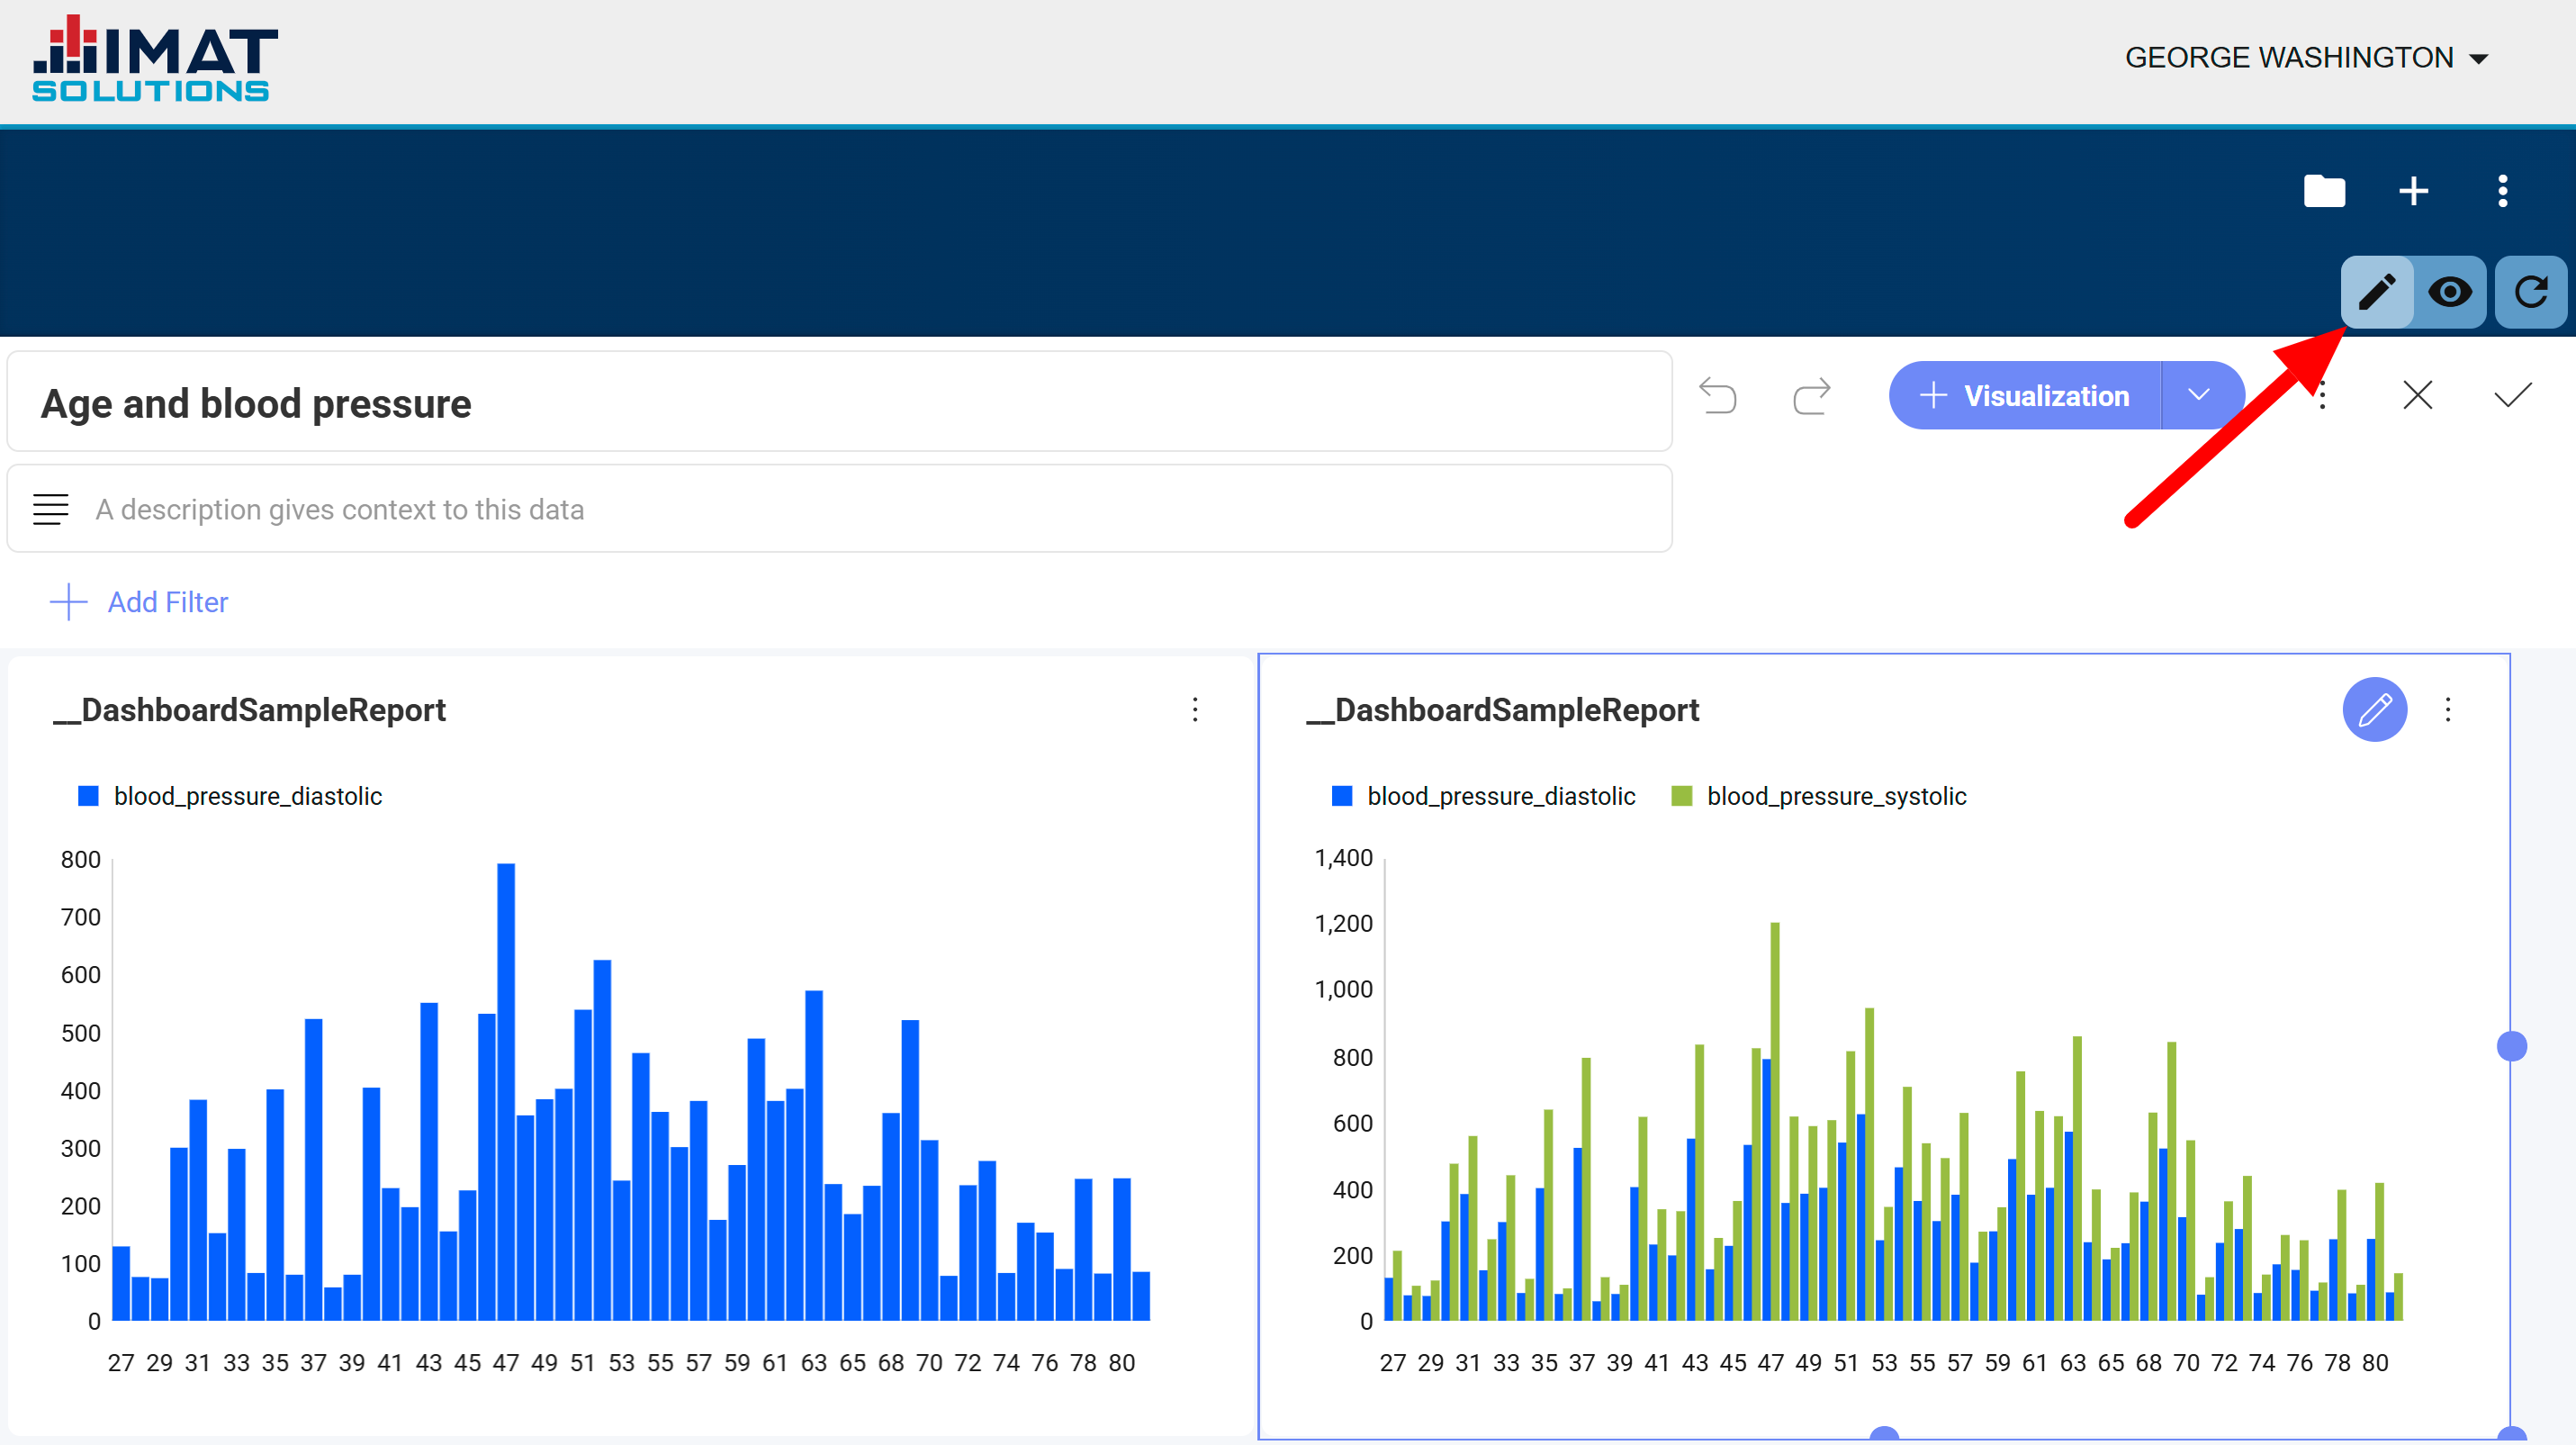 Click on the image to zoom.
Edit Dashboard
To edit a dashboard after it has been saved, follow these steps:
Go to Dashboards.
Click and select the dashboard you want to edit.
Switch to edit mode, , when the dashboard loads.
You may do the following:
edit the name
edit the description
edit individual visualizations
add a visualization by clicking
Click to save and close the dashboard or to cancel without saving.
Click to go back to view mode without saving. Know, though, that all changes will be lost.
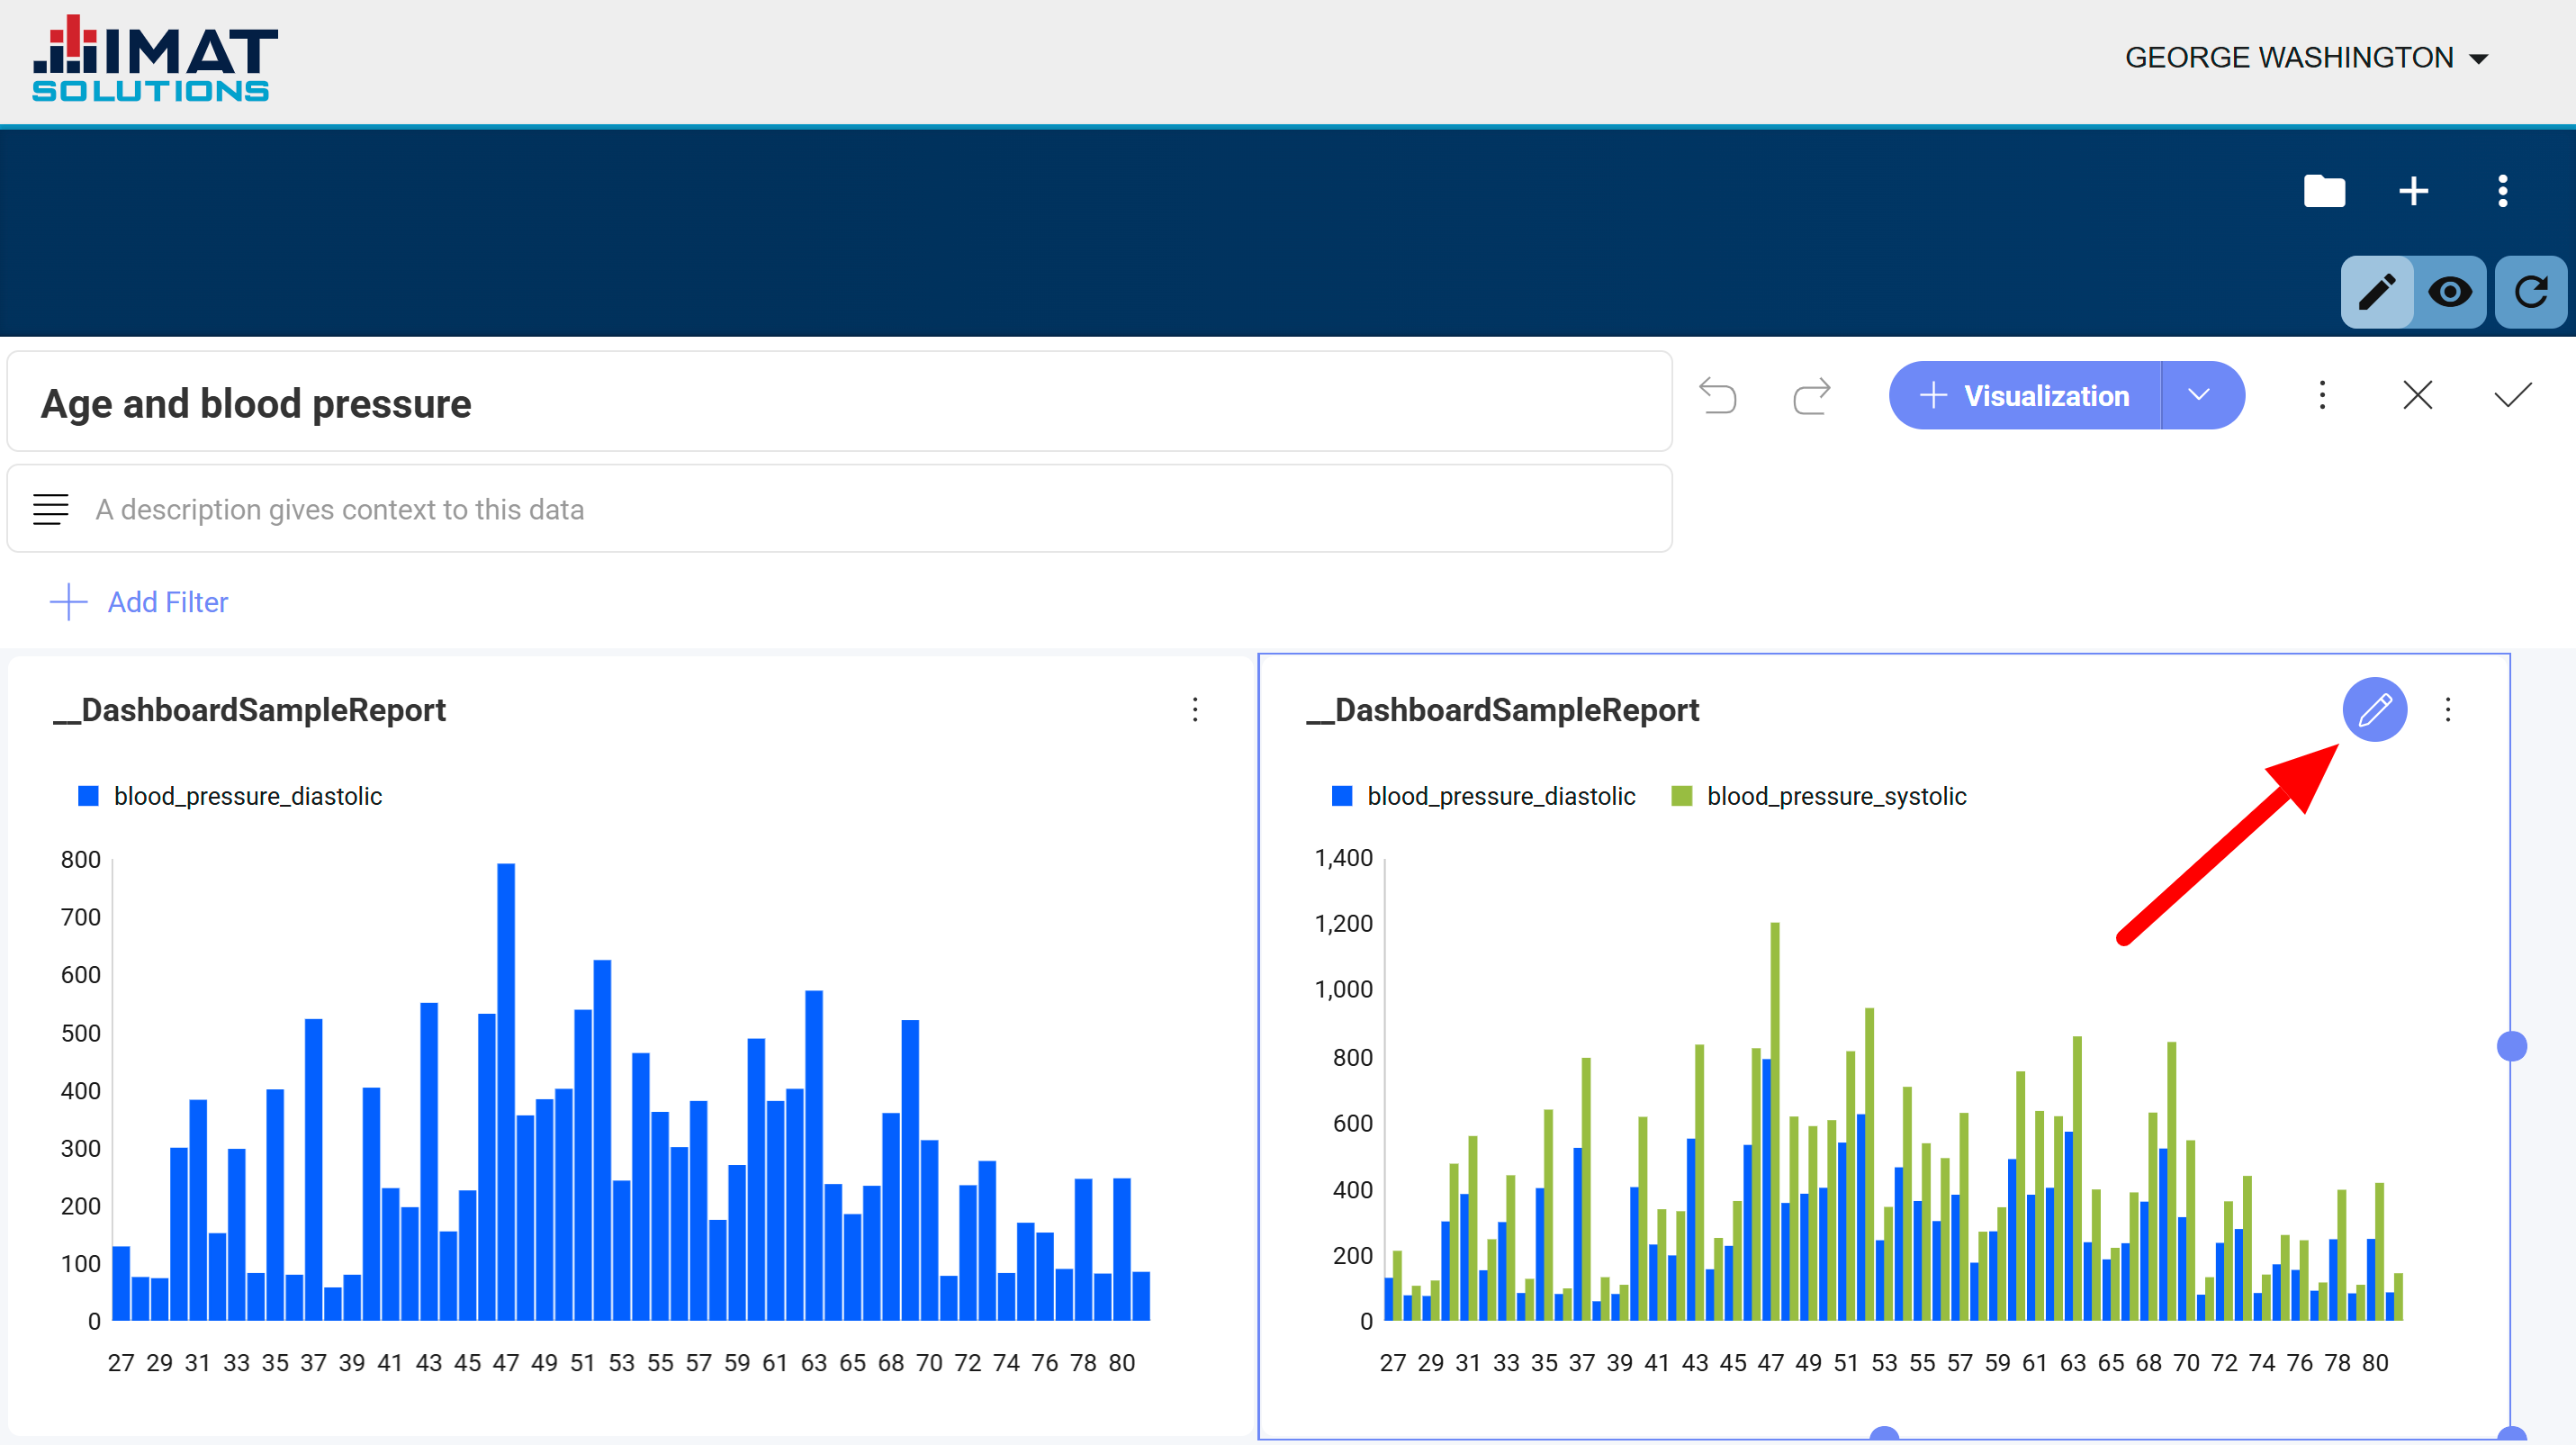 Click on the image to zoom.
Edit Visualization
Visualizations can be edited after they’ve been saved. To do so, follow the steps below:
Go to Dashboards.
Enter edit mode on the dashboard.
Choose (arrow shown) or on the visualization.
Edit the visualization by clicking on and changing the same options as in Step 7 in the Create Dashboard section.
Resize the box by using the sizing handles on the left and bottom of the selected visualization.
Click to save and close the dashboard or to cancel without saving.
Click to go back to view mode without saving. Know, though, that all changes will be lost.
Share Dashboard
Admins can share any created dashboard through the Sharing page. They will have to share all reports associated with the dashboard and the dashboard with the correct users.
Delete Dashboard
Deleting a dashboard removes all visualizations and the dashboard.
Select the dashboard you want to delete.
Click found next to the name or in the visualization itself.
Choose Delete.
Click to confirm.
Delete Visualization
Deleting a visualization does not delete the dashboard. Any other visualizations on the dashboard will remain.
Select the dashboard you want to delete.
Select the visualization.
Click .
Choose Delete. Visualizations are removed immediately without asking for confirmation. However, no changes are final until the dashboard is saved.
Click to save the dashboard.
Verification Failure
"Status 400. Message: The report did not write a results.csv artifact file."
When selecting a report for a visualization, you may encounter this. It appears when the compound report has not been written to include the results.csv file. To fix this error, return to the report and include similar code as found below:
with artifacts.open('result.csv', 'w') as file_handle:
    file_handle.write(your_csv_data)
* By default, it displays the query or report name. This is the only place where the name of the corresponding report is shown. If you change the visualization name, you will no longer be able to see which report was used for the visualization. This is true for every report or query used on the dashboard.
IMAT uses Reveal software for visualizations; you may find their documentation helpful.