Clinical Reports allows for two types of reports: Single or Compound. Single queries execute one report at a time, whether it is a one word report or a report built using the report builder. Compound reports execute a script that runs several reports that build upon the results of the previous report.
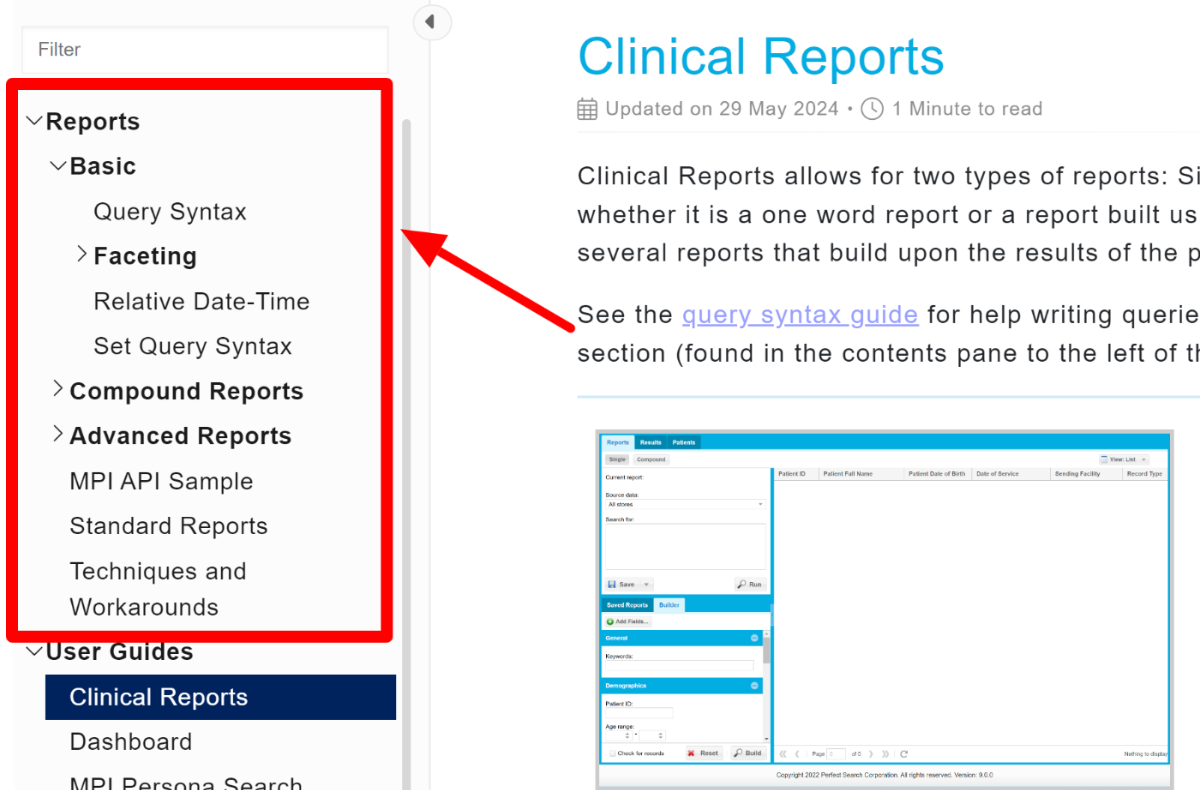
See the query syntax guide for help writing queries and reports. You may also find other articles in the Reports section (found in the contents pane on the left of this screen) helpful.
 Click to zoom
Single Query
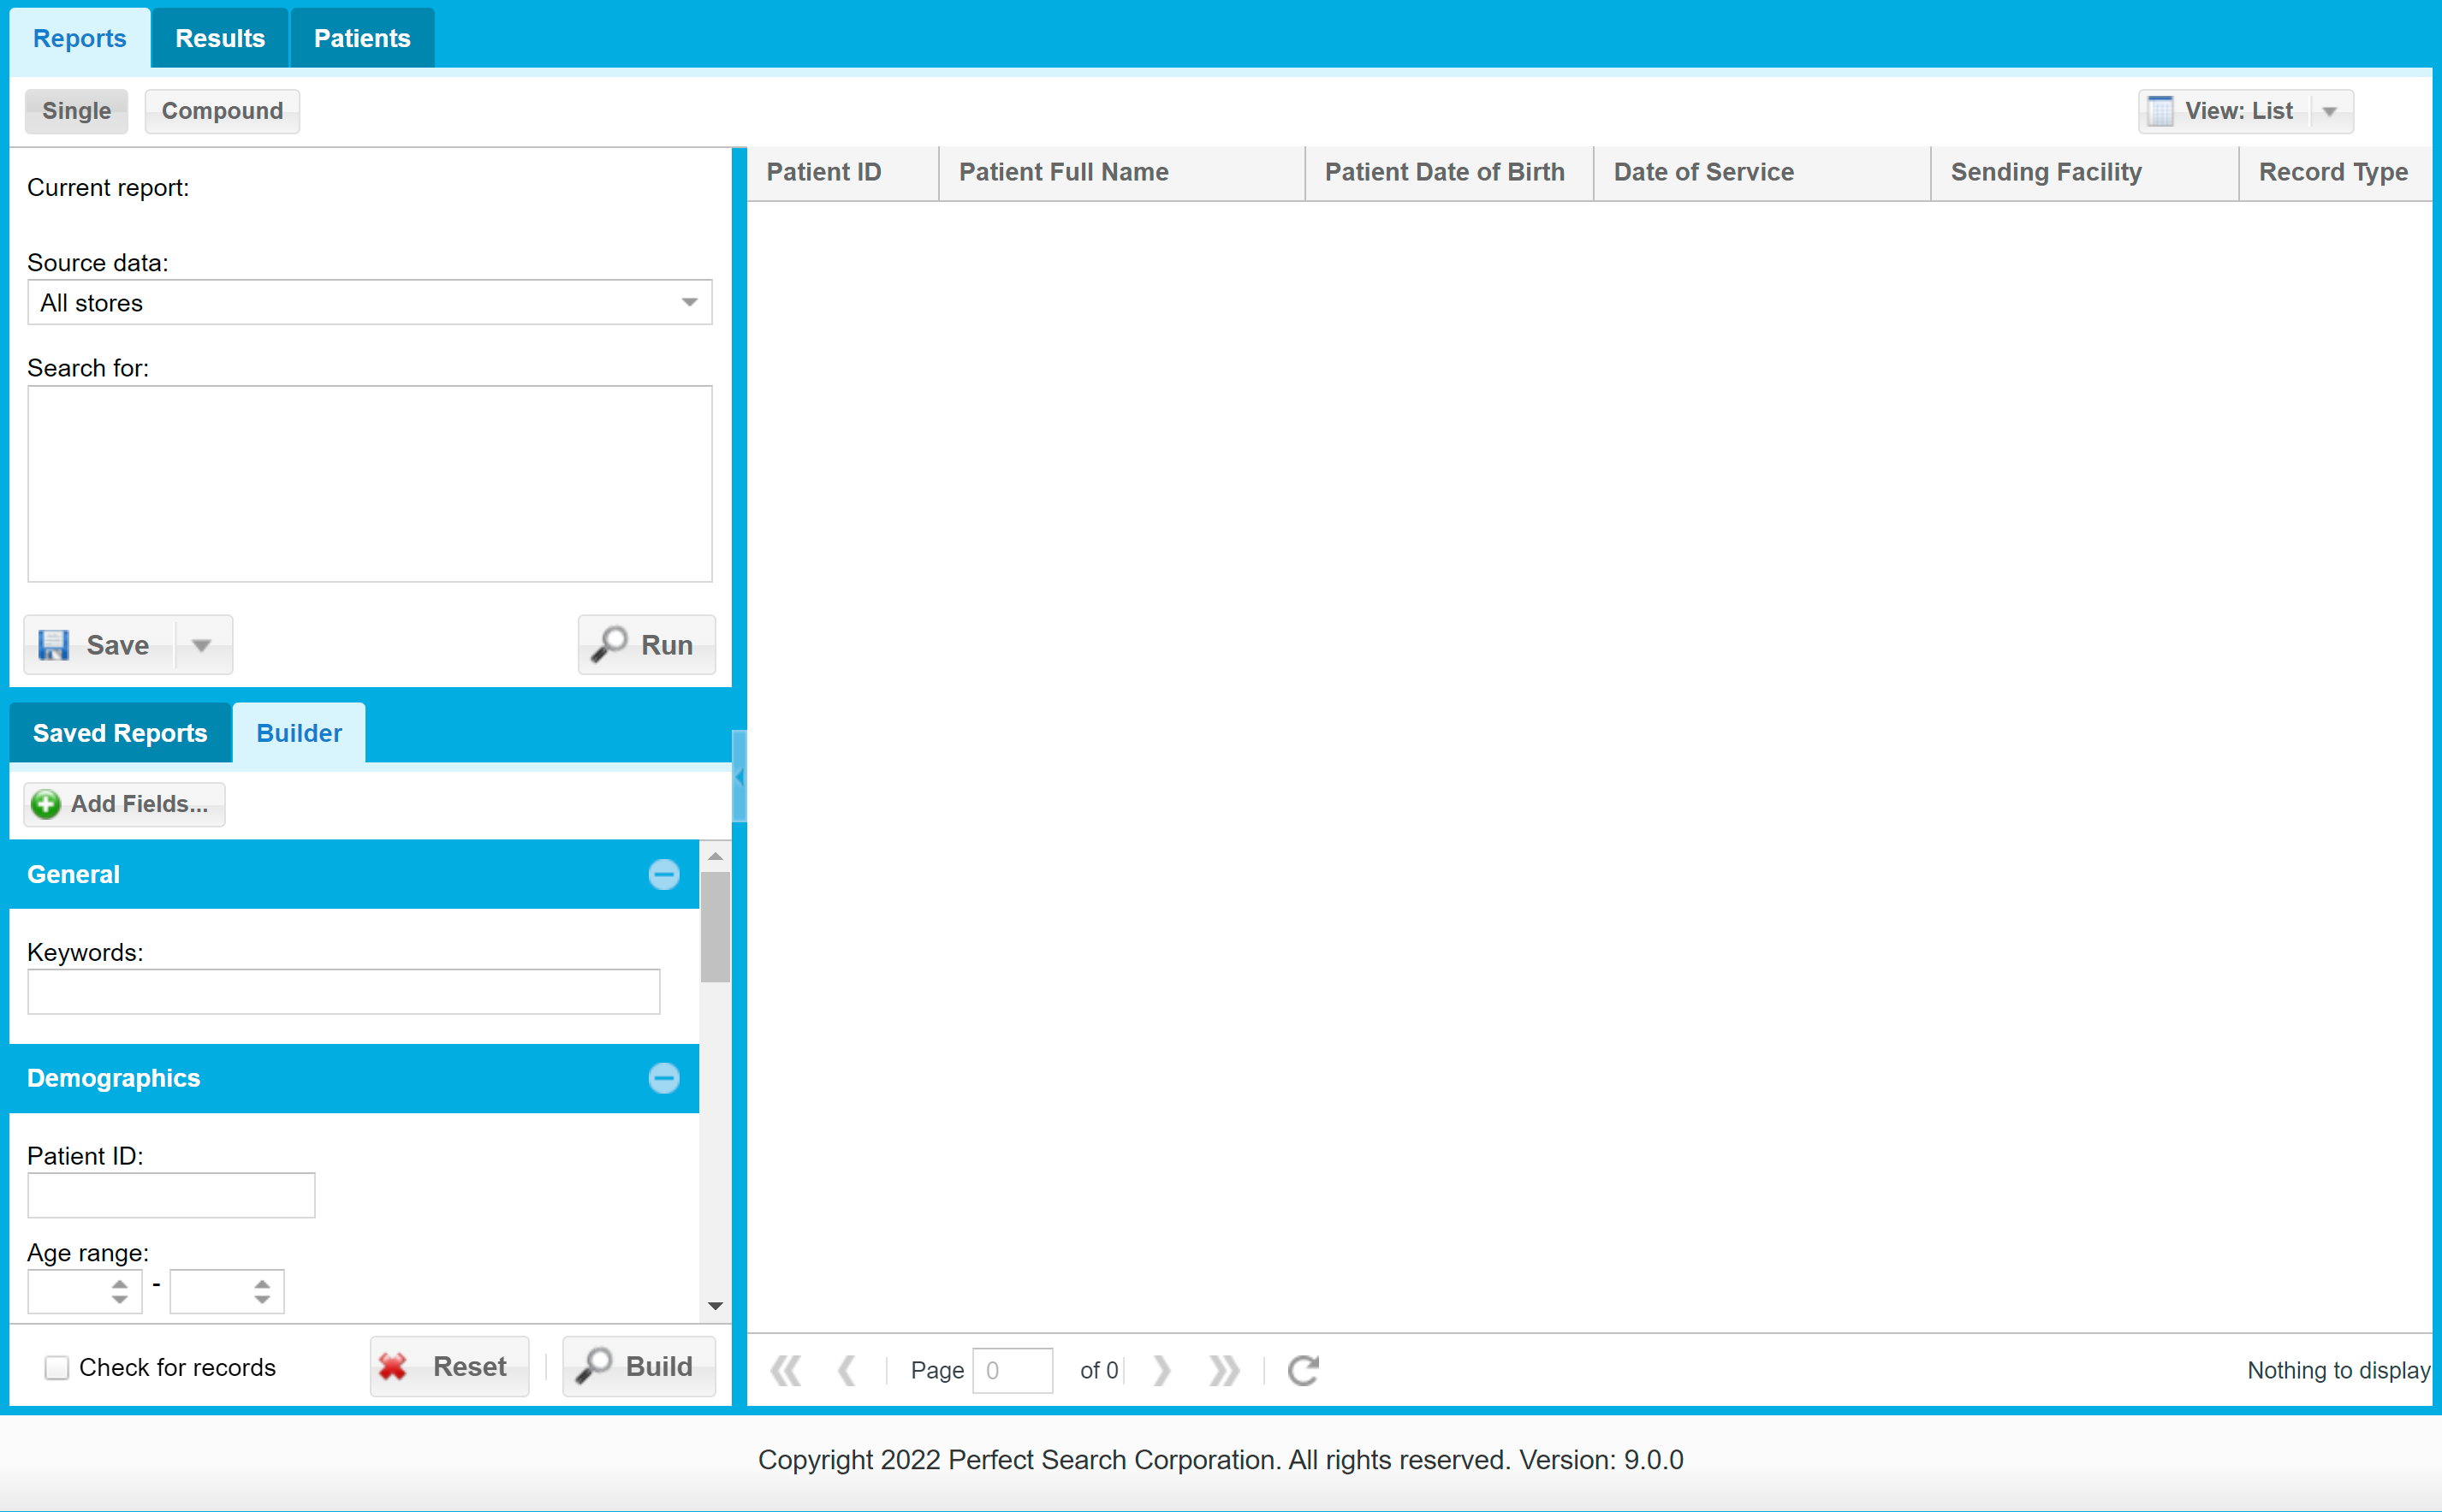
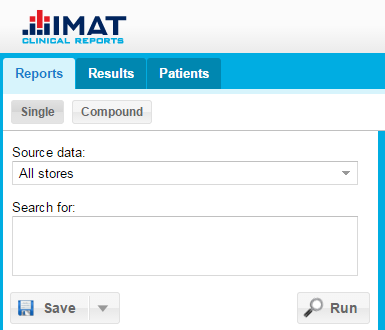
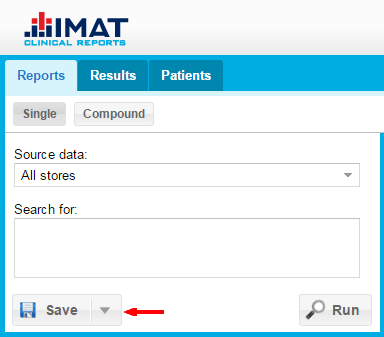
The single query interface is the default report interface when logging into Clinical Reports. The Single Query search is best used for searches that can be achieved through one query. However, that query may have multiple terms in it. Note that these are sometimes referred to as single reports. To access the single queries, make sure you are on the Reports tab and that Single is selected.
 Click to zoom
Run a Single Query
- Use the Source data field to select the store to search.
- Enter the search term or phrase in the Search for field.
- Click the Run button to run the search.
 Click to zoom
Build a Single Query
When a report needs to search for demographic information or medical codes, do the following:
- Select the store to search from the Source data field.
- Click the Builder tab. This reveals a new panel with sections for building a report that will be discussed below.
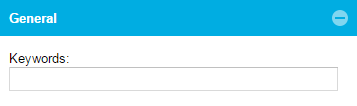
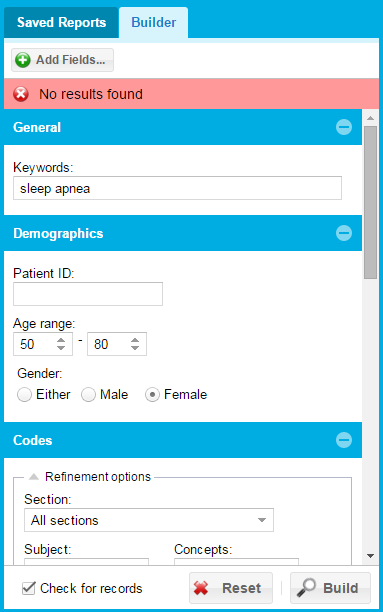
General
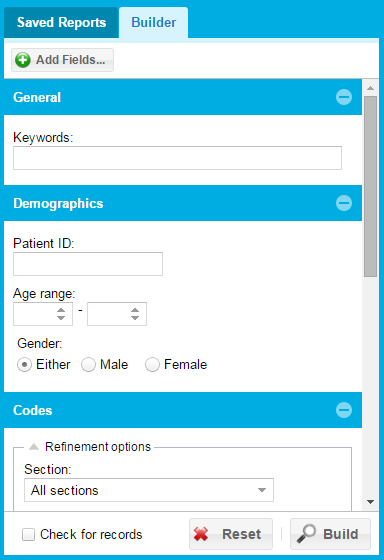
The General section contains a Keywords field, where basic search terms should be entered. These basic terms could include single words and phrases as a report.
 Click to zoom
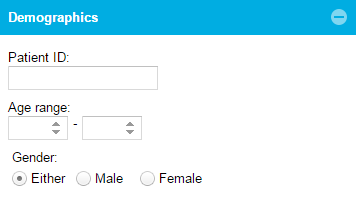
Demographics
The Demographics section contains search fields pertaining to patient identification, age, and gender.
- Patient ID
This field may contain a partial or complete identification number for a patient.
- Age range
If only the first age field has a value entered in the Age Range field, the report will search only that age. When only the second age field has a value entered, the report will search the range of zero to the entered value. If both fields are completed, the search will search for the range of values.
 Click to zoom
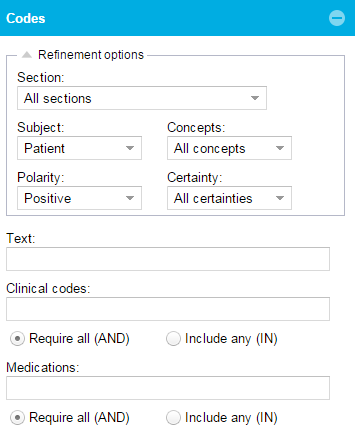
Codes
The Codes section contains various fields that search specific sections, subjects, concepts, polarity, and certainty.
Refinement options
- Sections
The Section drop-down list switches the search from all record sections to searching a specific section, such as Current Problems.
- Subject
The Subject drop-down list allows for switching between searching for the patient or the family of that patient as the object of the search.
- Polarity
The Polarity field allows changes from searching for someone who has (Positive), does not have (Negative), or is uncertain (Unknown) regarding the searched term.
- Concepts
The Concepts field allows searching specific concepts of the record: Problems, Procedures, Symptoms, Medications, Labs, Allergies, and Measures.
- Certainty
The Certainty drop-down list allows searching for how certain the doctor is about whether the patient has the search term. The search interface allows searching for all certainties, or if the diagnosis was certain or uncertain.
- Text
The Text field is a keyword search that searches text that cTAKES data processing has marked as medically significant.
- Clinical Codes and Medications
The search can also be constrained by clinical codes (SNOMED) or medications (RxNorm).
 Click to zoom
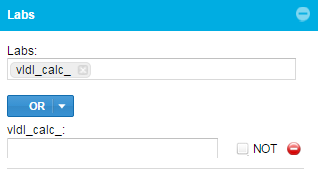
Labs
The Labs section allows for the searching of specific labs and inputting additional range or text information that is pertinent to the labs.
Search for and select labs to constrain the search by typing them into the Labs field. For each lab that is selected, there will be an additional field added to this section that is used to input the additional information. Each field will have the same options described in the Custom section.
 Click to zoom
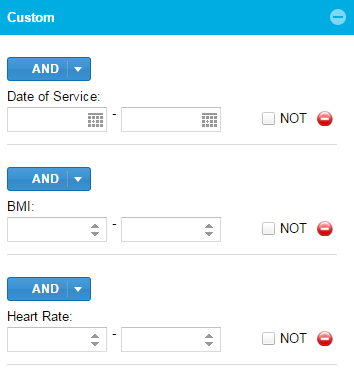
Custom
The Custom section will display fields that have been added from the Add Fields window.
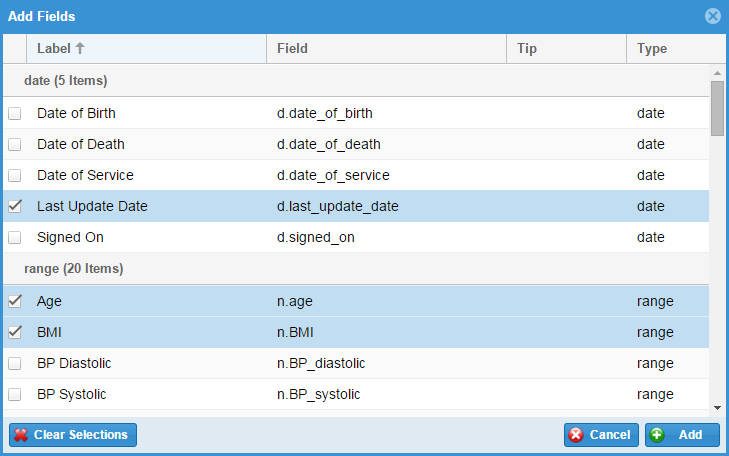
Add Fields
To add fields to the Custom section, click on the Add Fields button found just below the blue Builder tab. The user can add as many fields as necessary. After the fields have been added, they can be customized to narrow or expand a search. Each field will have the following options:
- AND/OR
Selecting AND or OR will determine how the custom field is related to the previous field.
- NOT
Selecting the NOT check box will include the Boolean NOT operator between the present field and the previous item.
- Entering Range
Each field may have a custom range entered. By entering a range, it allows for the server to only return hits that fit the desired range, this can greatly reduce the number of undesired hits in the results. If the range fields are left blank, all records that include the information will be returned.
- Removing Custom Fields
Any of the custom fields can be removed one at a time by clicking the red circle with a line through it, located to the right of NOT of each field.
 Click to zoom
Select Fields
In the Add Fields dialog box, select any needed fields to add to the search form (by clicking the check box next to the field), then click Add.
 Click to zoom
Check for Records
Check for Records provides an immediate notification when the entered search constraints are producing errors or will not return search results. Turn on Check for records by selecting the check box at the bottom of the Builder panel.
Reset
The Reset button will clear all entered form values and remove any custom fields.
Build
The Build button will take the form values entered and translate them to the query language of the appliance. The query will then be displayed in the Search for field; after which, the search will then be executed.
 Click to zoom
Save a Single Query
To save a query, click the Save button below the Search For field. In the Save Report window, enter the preferred report name in the field and click Save.
Reports can also be saved by clicking Ctrl + S on the keyboard while search field is selected.
To clear the current report and start a new report, click New from the menu that appears when the arrow next to the Save button is clicked.
To save a copy of the report, click the arrow next to the Save button, then click Save As from the menu.
Rename a Query
- Select the report to rename from the list of reports.
- Press F2 on the keyboard (Mac users, press fn + F2).
- Type in the new name.
- Press Enter on the keyboard.
 Click to zoom
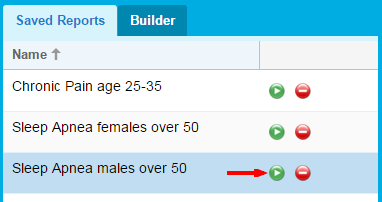
Run a Saved Query
- Find the report in the Saved Report list.
- Click the green play button.
 Click to zoom
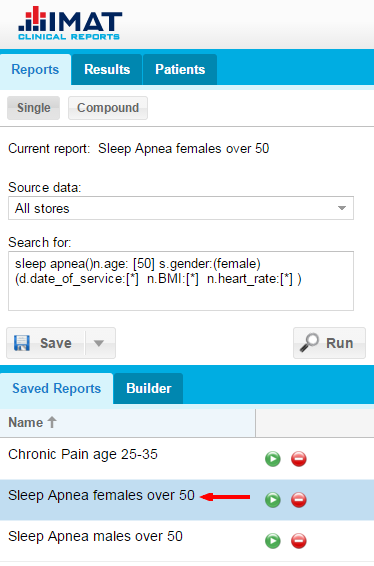
View a Saved Query
- Find the report in the Saved Report list.
- Click anywhere on the row of the saved report.
After which the report will be populated in the Search For field.
 Click to zoom
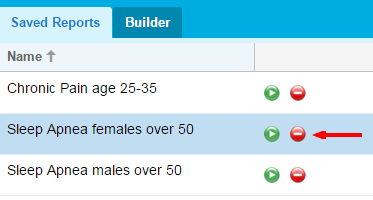
Delete a Saved Query
- Find the report in the Saved Reports list.
- Click the red button on the same row.
- Confirm deletion by clicking Yes.
 Click to zoom
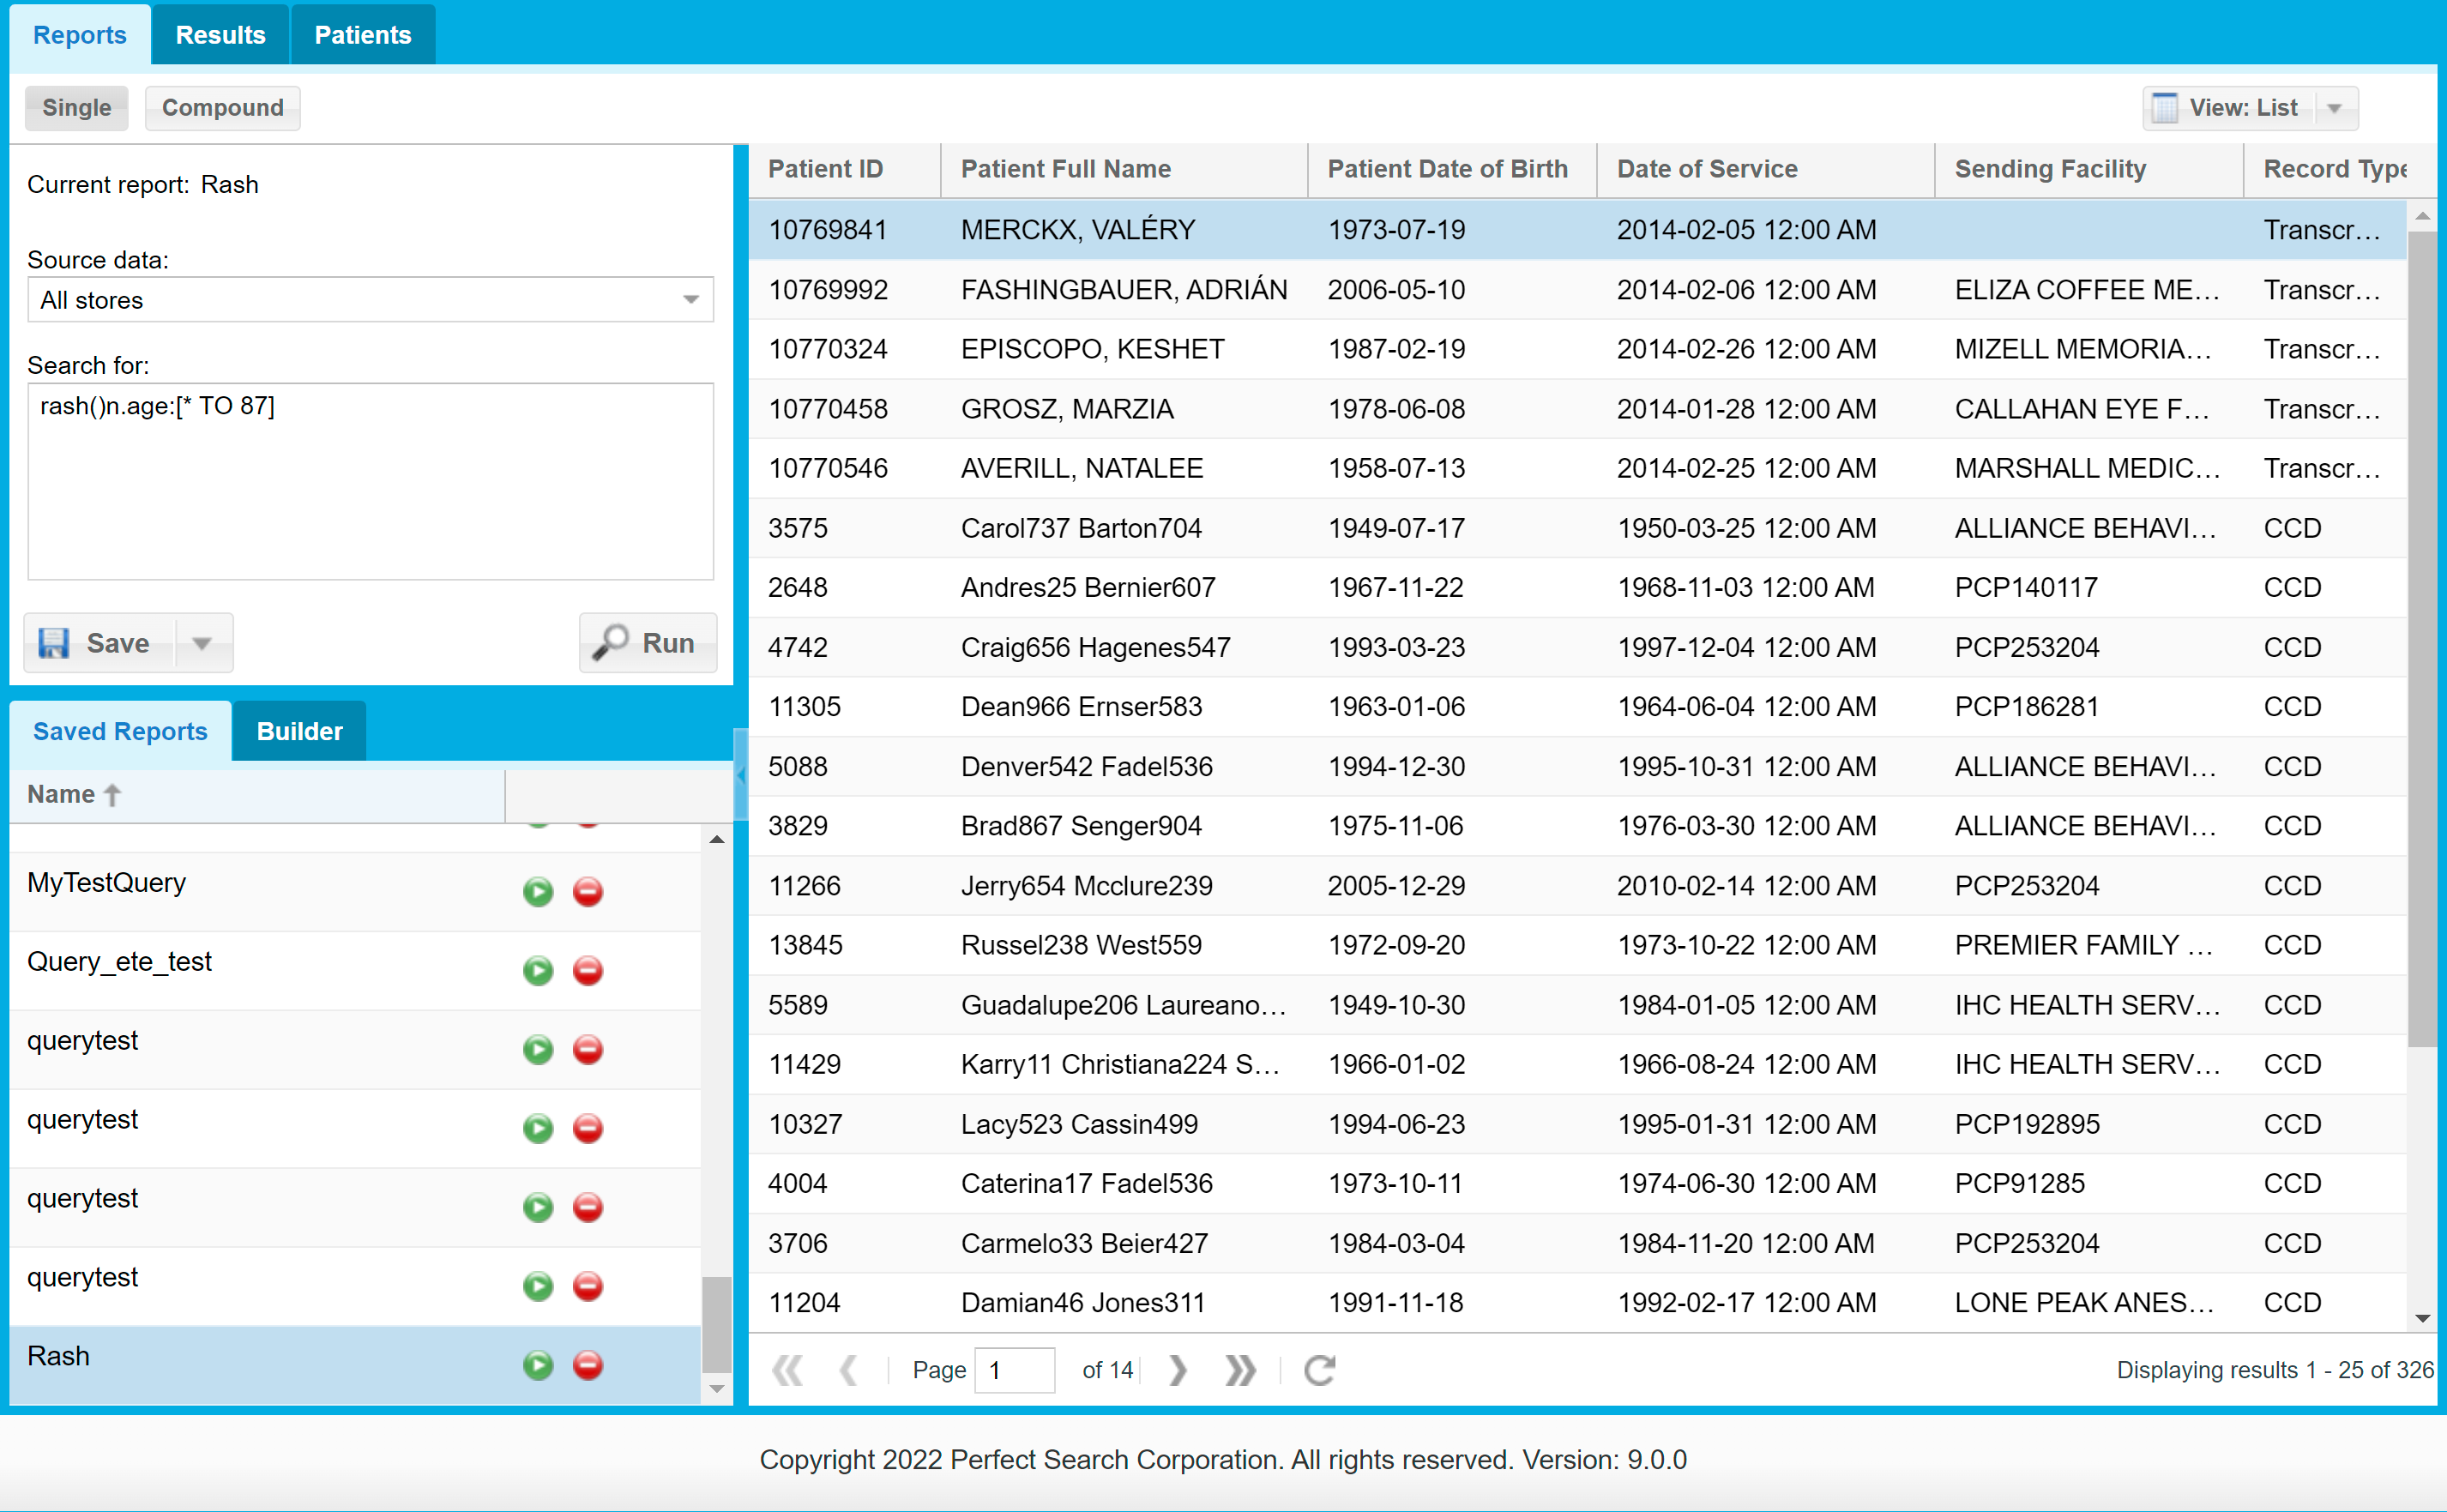
View Results
When a search is completed, the results appear in the grid on the right side of the screen. These results can be inspected on an individual record level. Click on the record in the list on the right side, and a patient view will open. For more information on the record, see the Patients section.
 Click to zoom
Compound Reports
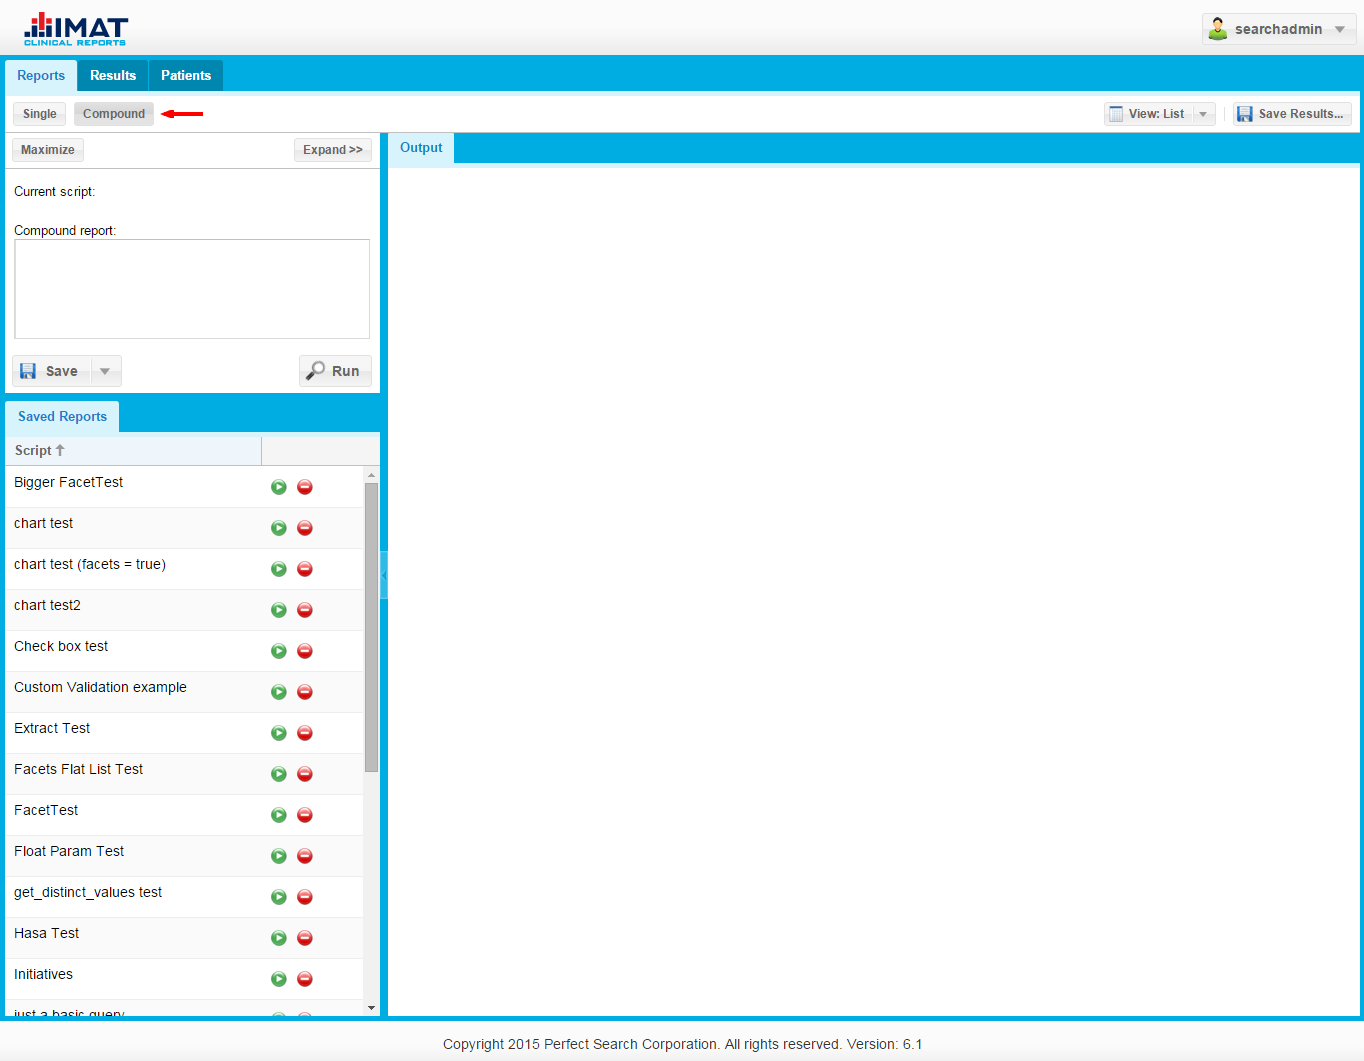
Compound reports can be accessed from clicking the Compound button in the Clinical Reports Search Interface.
 Click to zoom
Maximize
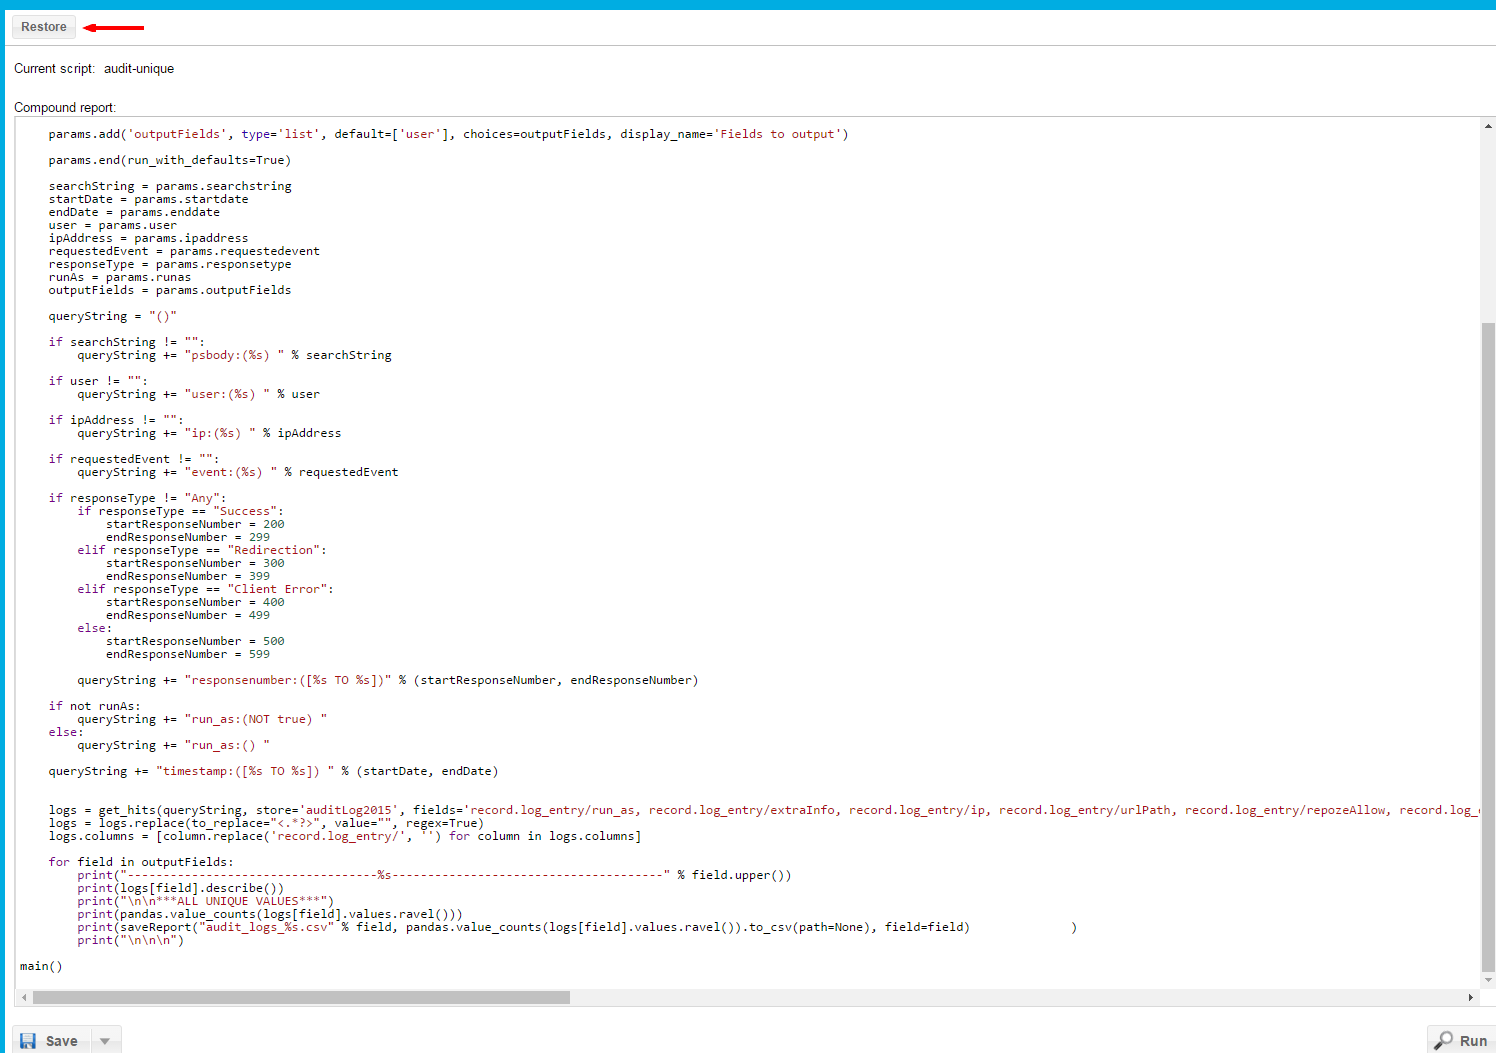
Clicking Maximize above the box where compound reports are entered will cause the compound report box to expand to the full browser size.
Press Restore in the top left corner to return to the original compound report screen.
 Click to zoom
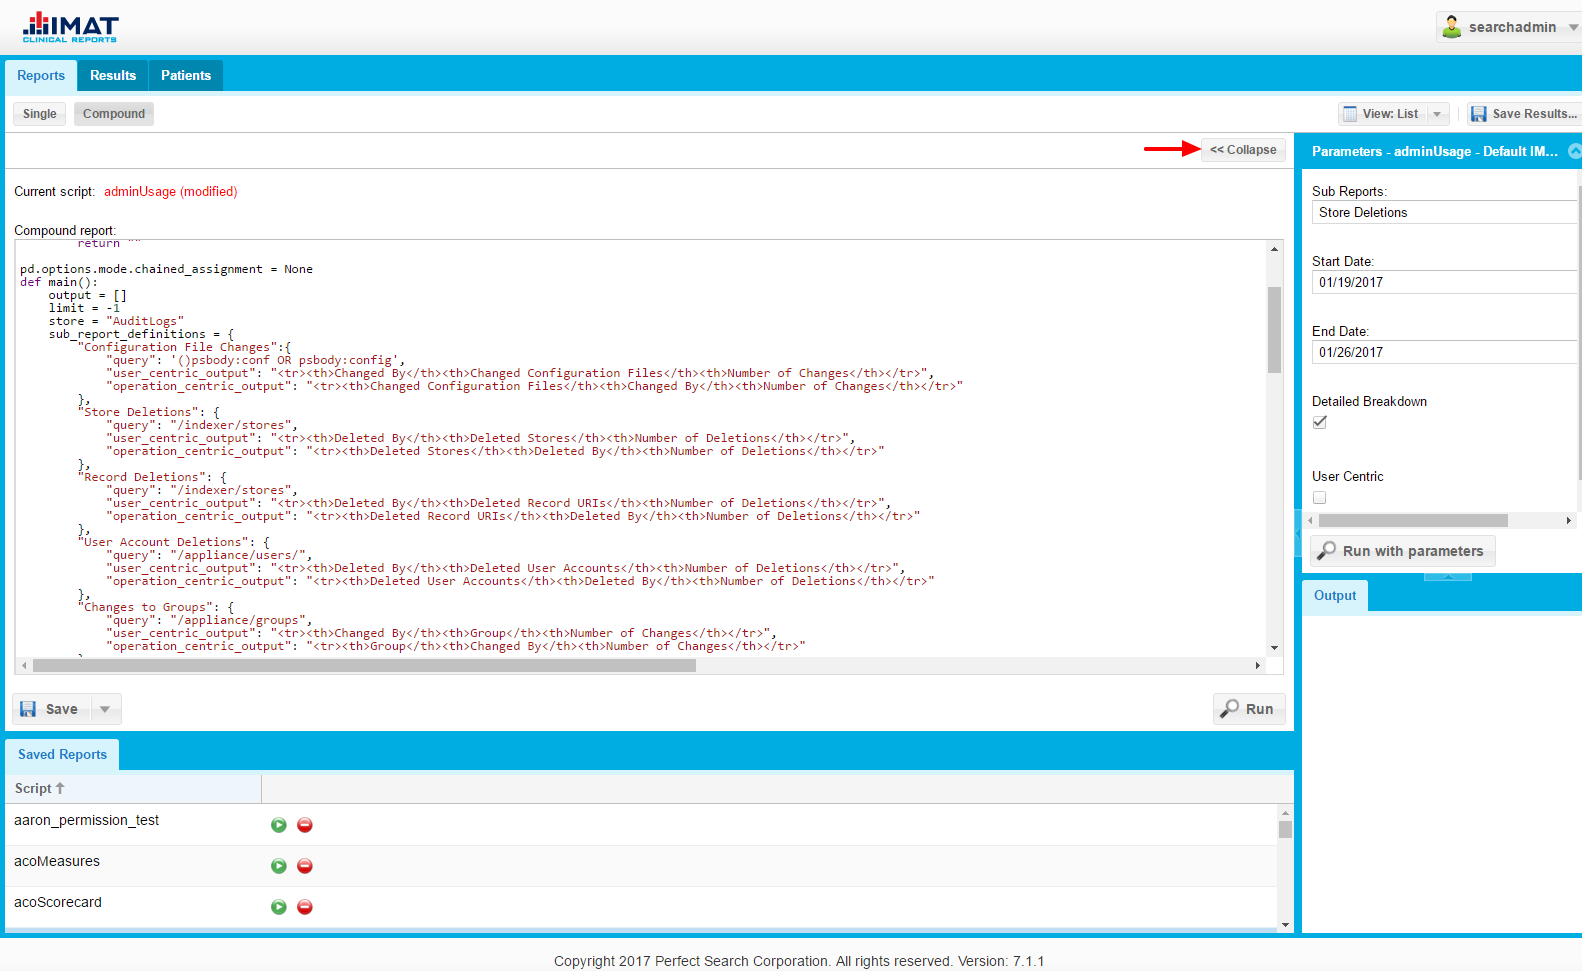
Expand
Clicking Expand>> above the box where compound reports are entered will cause the compound report box to become bigger while still allowing the user to see the other sections of the compound report screen.
Press <<Collapse in the top right corner of the compound report box to return to the original compound report screen.
 Click to zoom
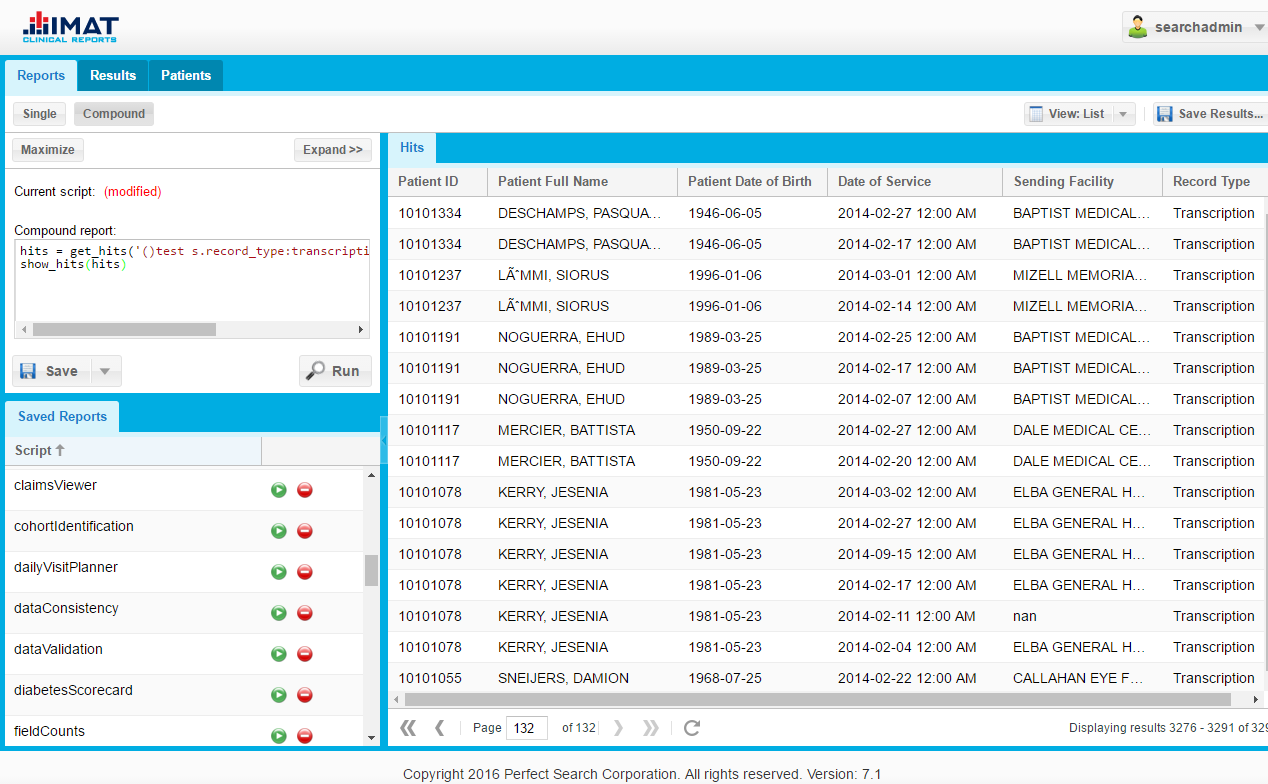
View Compound Reports Results Grid
When a search is run, the results appear in the grid on the right side of the screen. However, in order to see the results in the grid, the report writer must use get_hits() and show_hits() as well as request the fields displayed in results grid. These results can be inspected on an individual record level. Click on the record in the list on the right side, and a patient view will be opened on the patient's tab. For more information on the record, please see the Patients section.
It is also possible to switch between viewing the list and viewing a chart. The results of the report may also be saved.
 Click to zoom
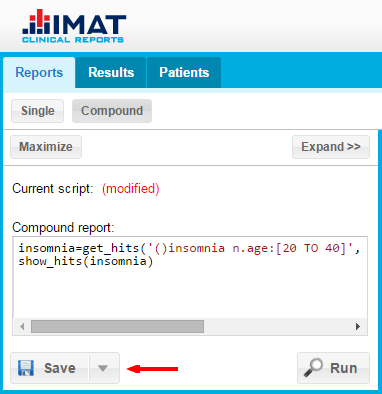
Save a Compound Report
To save a compound report, click Save. In the Save Compound Report window, follow the steps below:
- Enter the report name in the field.
- Click Save.
Reports can also be saved by clicking Ctrl + S on the keyboard while search field is selected.
To clear the current report and start with a new report, click New from the menu that appears when the arrow next to the button is clicked.
To save a copy of the report, click Save As from the menu that appears when the arrow next to the button is clicked.
Rename a Report
- Select the report to rename from the list of reports.
- Press F2 on the keyboard (Mac users, press fn + F2).
- Type in the new name.
- Press Enter on the keyboard.
 Click to zoom
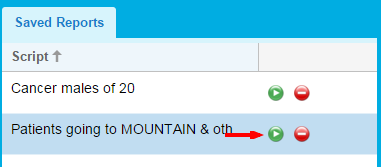
Run a Saved Report
To run a saved script, click the blue button on the same row as the saved report in the Saved Reports list.
 Click to zoom
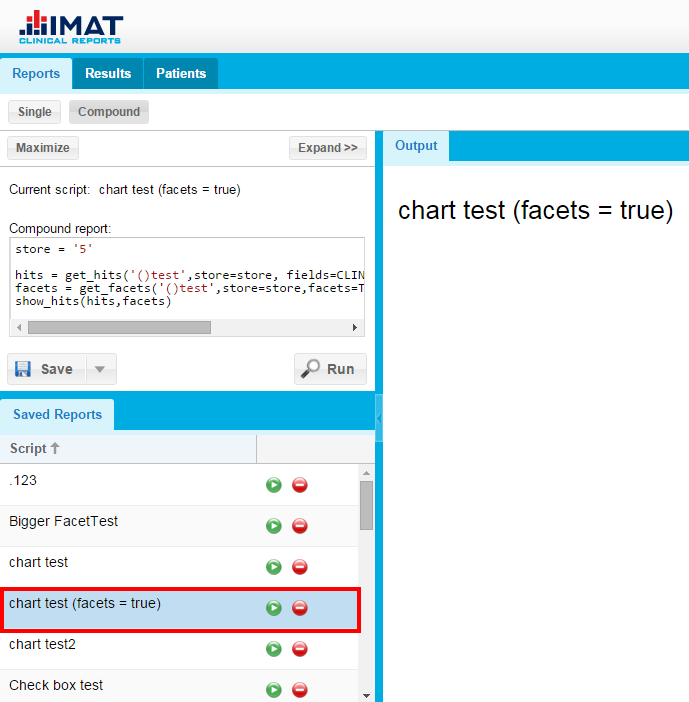
View a Saved Report
To view a saved script, click anywhere on the row of the saved report in the Saved Reports list. The script will then be visible in the Compound report text box.
 Click to zoom
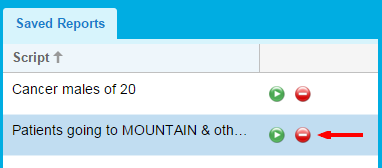
Delete a Saved Report
To delete a saved script, click the red button on the same row as the saved report in the Saved Reports list, and then confirm deletion by clicking Yes.
Build a Compound Report
For help building a compound report, contact the Support Engineer assigned to the company or see the reports documentation for more information.
 Click to zoom
Run a Compound Report
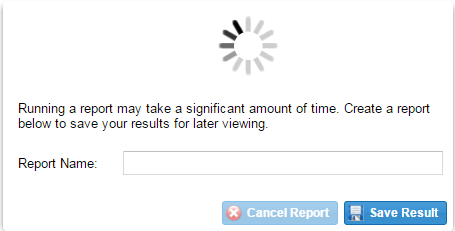
After a compound report has been entered and the Run button has been pushed, a dialog box will appear saying, "Running a report may take a significant amount of time. Create a report below to save your results for later viewing." Enter a name for the report and press Save Result. By entering a report name and saving the results, the report will continue to run in the background and appear on the results page once the report is finished. Otherwise, press Cancel Report. If nothing is done in the dialog, the report will continue to run until the results are returned. For more information on compound reports see the Compound Reports section.
 Click to zoom
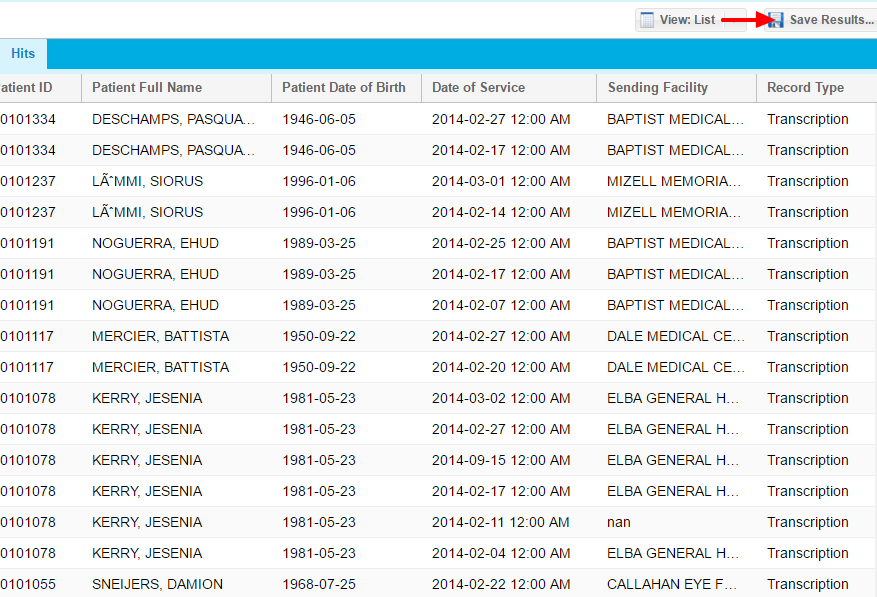
Save Results
Once a compound report has been generated, it is possible to save the results of that report. To do so, click Save Results in the top right corner. It can be viewed later in the Results tab. The default format is XML and will be saved as a search type.
To print either saved results or the results of a compound report, press Ctrl + P on a PC keyboard, Command + P on a Mac keyboard, or choose Print from your browser's menu.
print() when writing the report.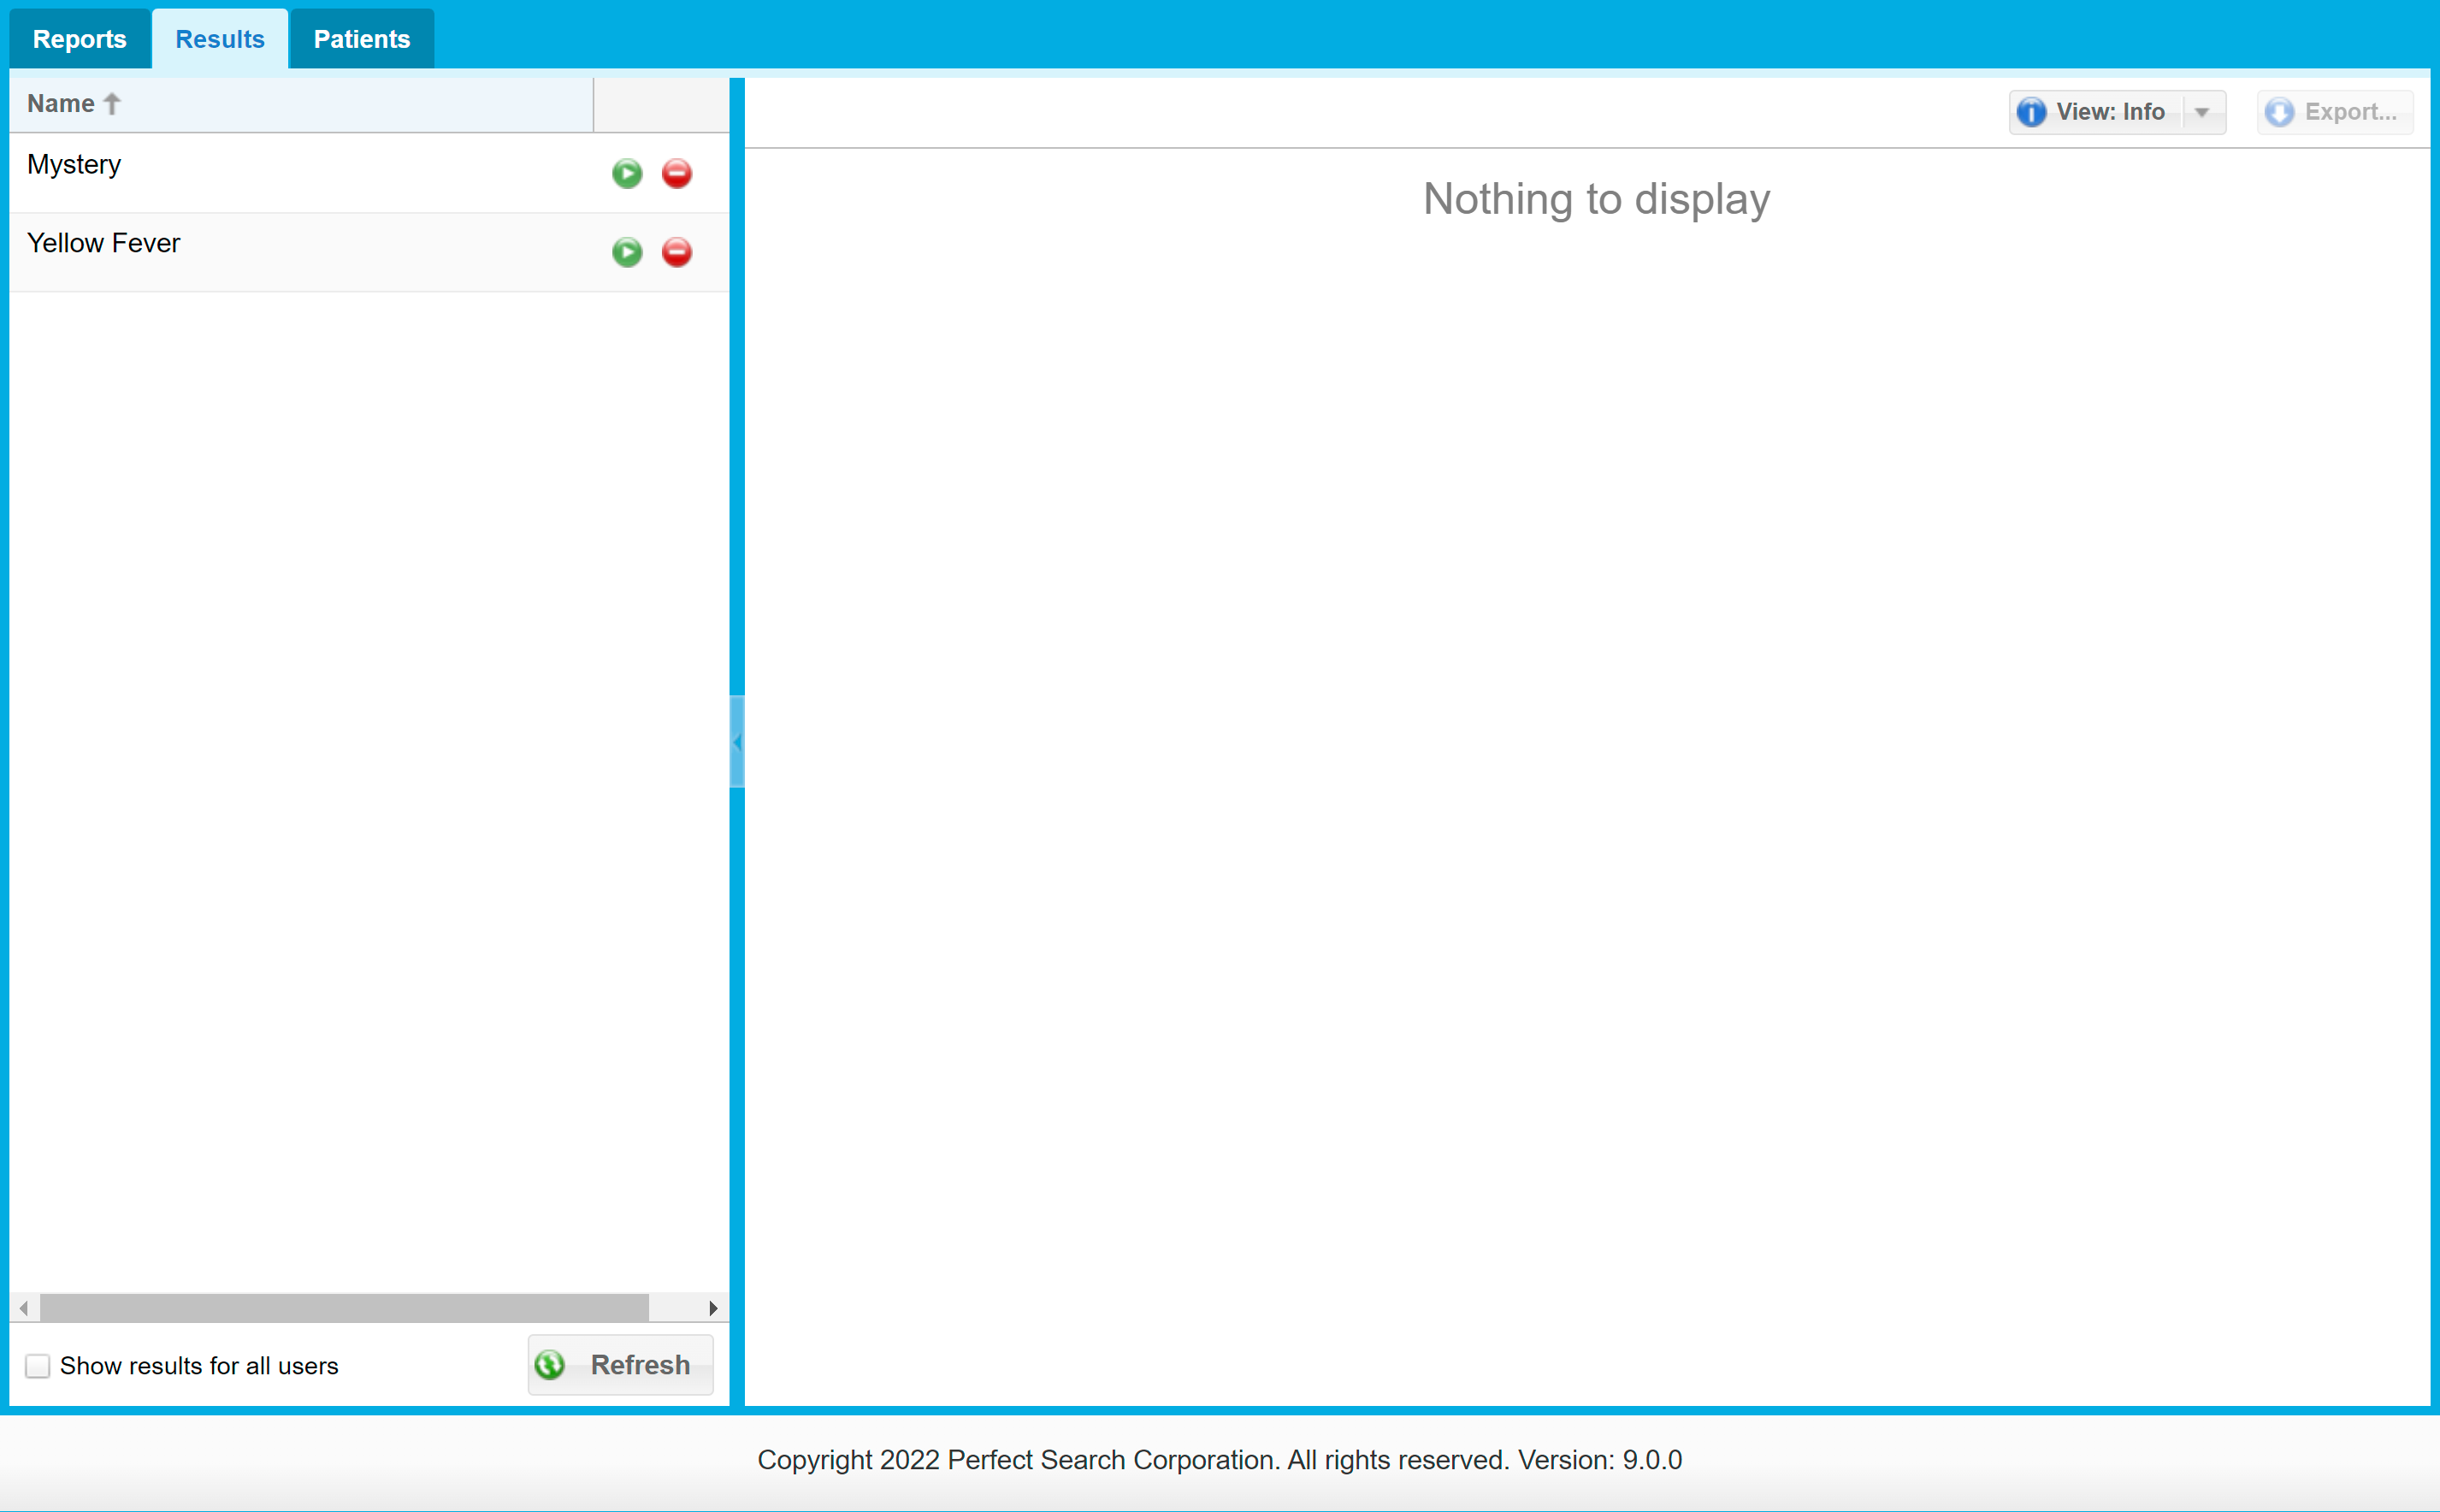 Click to zoom
Results
The Results tab allows interacting with long-running report and viewing results of past reports. The Results tab contains a list of all the results, and a view panel to show information from the results.
.png) Click to zoom
Click to zoomResults List
The Results list is made up of two columns:
- Name
The name column displays the report name chosen at export or from the long-running report dialog box.
- Actions
In the Actions column, the result can be deleted.
Show results for all users
The Show results for all users option is available for administrators to view a list of all the results on the appliance. Administrators can download or delete results created by other users.
Refresh
To refresh the view of the search results, click Refresh.
Rename a Result
Do the following to rename a result:
- Select the result to rename from the list of results.
- Press F2 on the keyboard (Mac users, press fn + F2).
- Type in the new name.
- Press Enter on the keyboard.
 Click to zoom
View Panel
The view panel can show three types of information about a result: Info, List, and Charts. To show information in the view panel, click on a result in the result list. To change the type of view, click the View button in the upper-right of the panel.
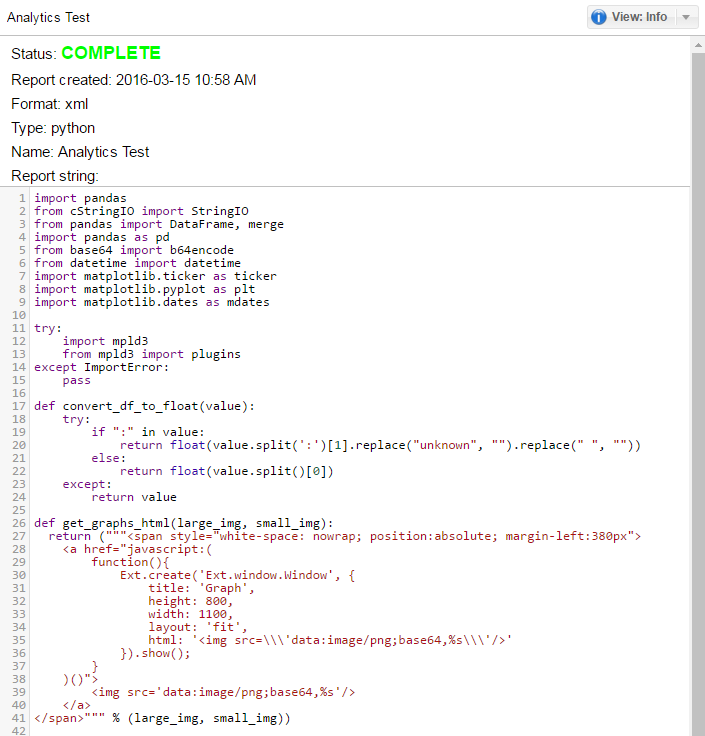
Info
Info is visible on all results. The info can be viewed by clicking the result in the results list, or by changing the view button in the upper-right of the panel.
Grid
Grid view is only visible on results that have a type of search. Individual records can be viewed by clicking on a row in the grid. For more information see the Patients section.
Charts
Viewing results in chart view is only visible on results that have a type of search. Charts can be interacted with the same way as on single or compound report. For more information see the Charts section.
Export
Export allows creation of a new result based on the data visible in the current report after drilling in on charts.
Charts
The Charts feature takes the search results and displays them as charts. This provides a visual representation of the searched data.
 Click to zoom
View Charts
Charts can be viewed instead of a list of data. However, it is important to note that when writing a single query, data must be pulled from only one store.
- Run a single or compound report; see Single Queries or Compound Reports for more information on running a report.
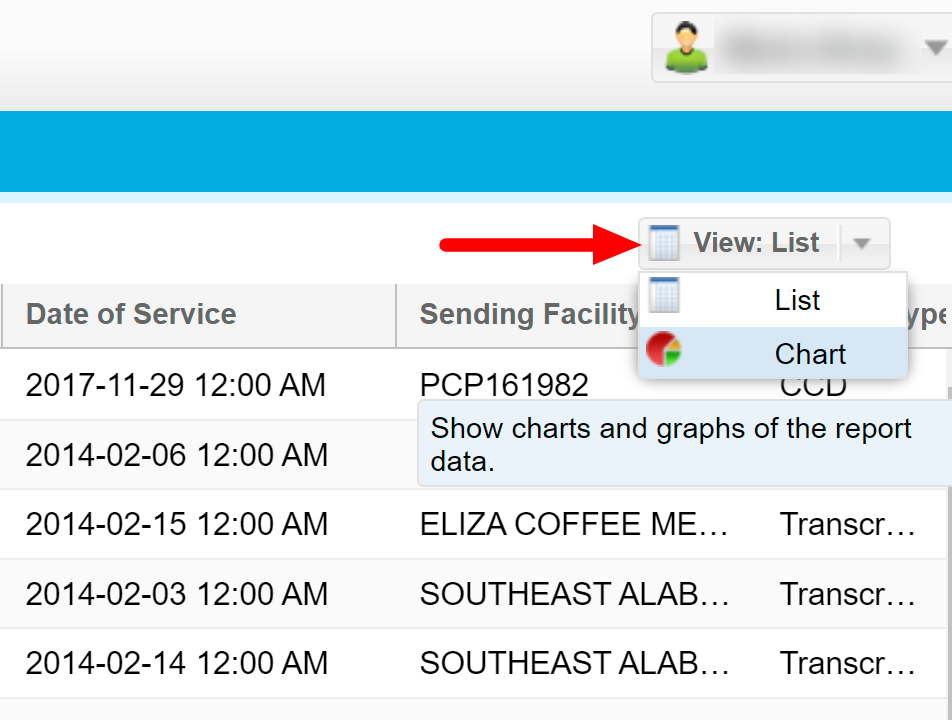
- Click on the View button in the top-right corner.
- Change the selection from View: Grid to View: Chart.
 Click to zoom
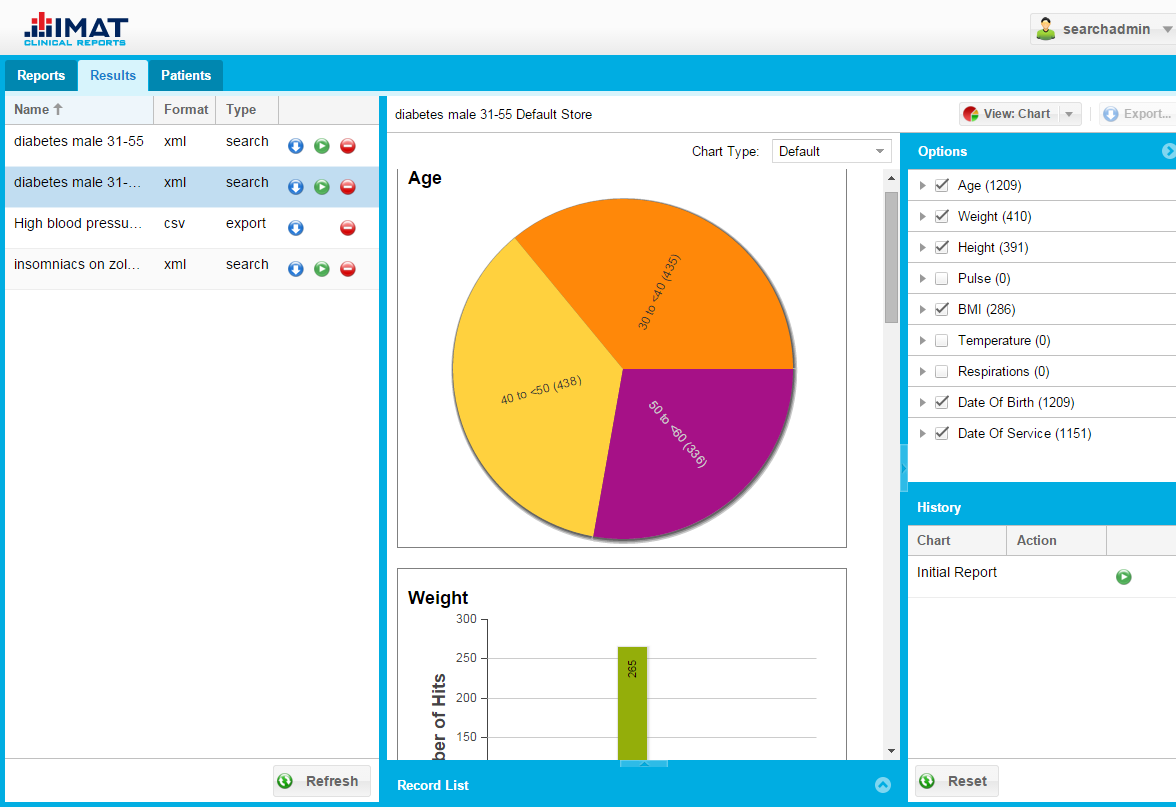
Charts View
After switching to Chart view, the right side of the screen will change to show several charts in the center, and an Options and History panel on the right. A Results panel is located at the bottom of the screen (and is minimized by default).
Chart Panel
The center panel, called the Chart panel, is where the charts are displayed.
 Click to zoom
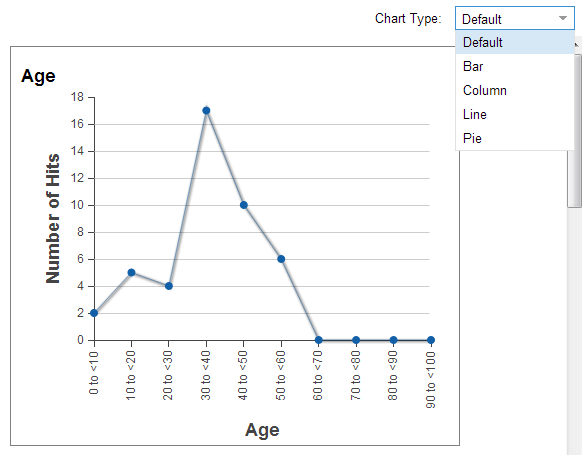
Change Chart Type
The charts have different viewing options, available through the Chart Type drop-down menu in the upper-right corner of the chart panel. The available options are Default, Bar, Column, Line, and Pie.
 Click to zoom
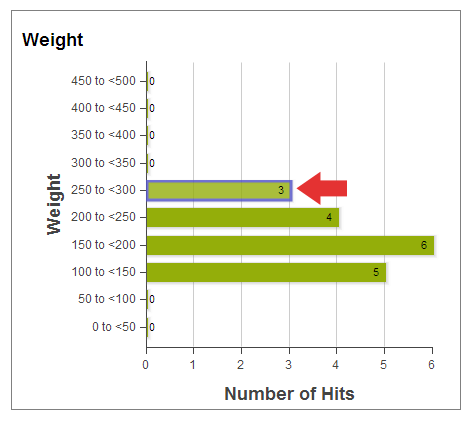
Drill Down
Drilling down narrows the search results to a more specific set of data. To drill down, click on the desired bucket in the chart (or if preferred, in the list shown after expanding a category in the Options panel).
After an item has been drilled down, it is possible to return to the list view to see the list of hits that match the smaller facet. Viewing the Record List also has the same results.
Right Panel
The right panel consists of an Options panel and a History panel. The right panel can be minimized by using either of the blue arrows.
 Click to zoom
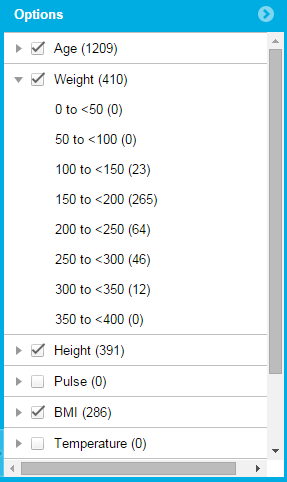
Options Panel
The Options panel contains a list of charts available to be viewed. Control which charts are visible by checking or unchecking the charts associated check box.
The small gray arrows to the left of each check box give the user the ability to view a more specific breakdown of each individual category.
 Click to zoom
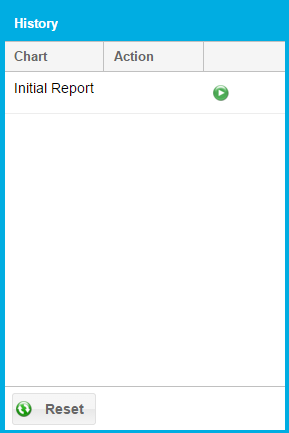
History Panel
The History panel displays the initial report as well as any subsequent actions taken by the user (e.g. drilling down) to further modify the initial results set. The panel also allows the user to return to any previous state by clicking on the green play button next to the desired action in the history grid.
The view can be also reset to the original report by clicking on the Reset button on the bottom.
 Click to zoom
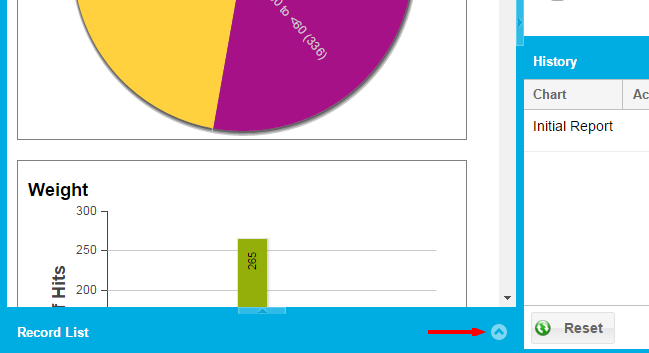
Record List
By default, the results panel is minimized at the bottom of the screen.
To expand the Record List panel, click the blue arrows located on the minimized bar.
When expanded, the Record List panel will show the results in the grid form that are currently being charted. It is possible to either scroll through the results or click on a specific result to load the patient view.
Patients
Clinical Reports allows any results tied to a patient ID to be viewed through the Patients tab: including the original document, other records for that patient, and summary information for the current record.
 Click to zoom
Open a Patient View
From the search panel, click on a record in the results list to load a new tab, referred to as a patient view. The patient view is located under the Patients tab. Once in the Patient tab, new tabs containing the patient's name and ID are available.
The Patients tab allows for more than one patient view to be open, but only one record per patient can be viewed at a time.
 Click to zoom
Close a Patient View
A patient view remains open until the browser is reloaded or the patient view is closed. This allows for multiple patient views to be opened simultaneously or to leave a patient view open while returning to the Reports tab to view the search where the patient view originated.
To close a patient view, click on the X in the top right corner of the patient view. To close all patient views at once, click on the Close All Patient Views button in the top right toolbar of the Patient display.
 Click to zoom
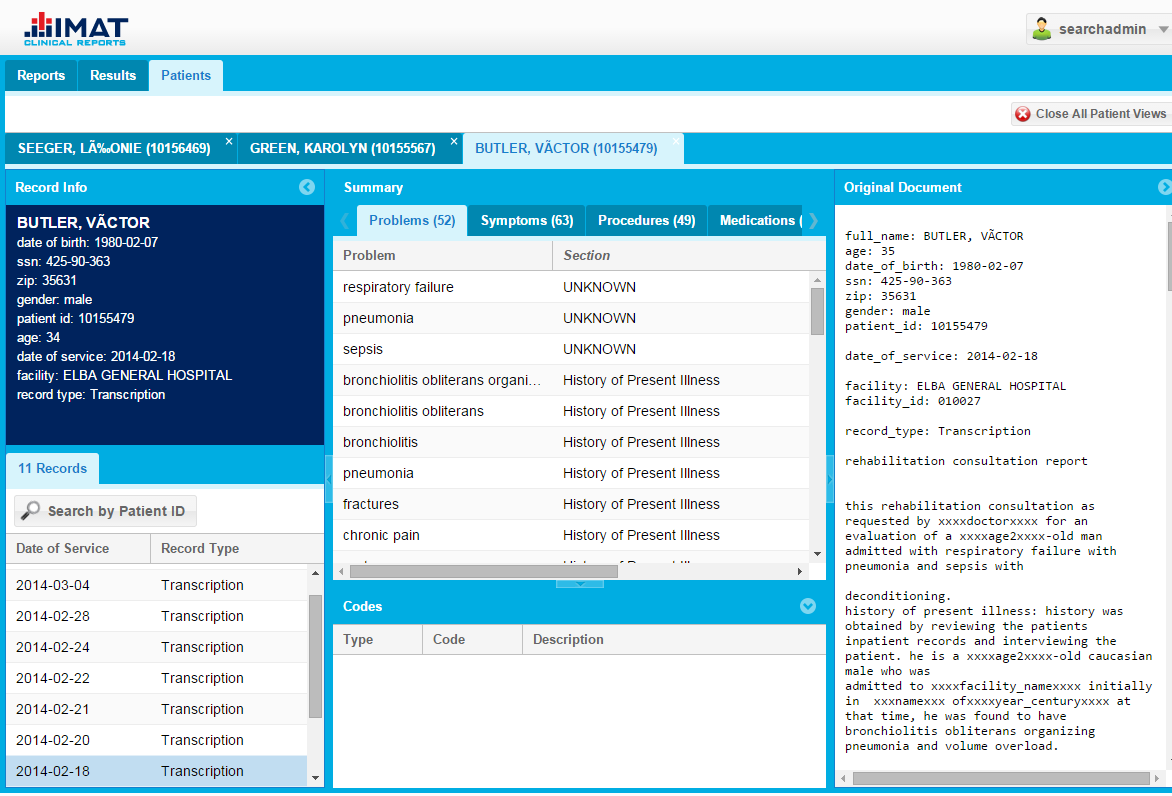
Parts of a Patient View
A patient view contains several sections:
- Demographics
- Records
- Summary
- Codes
- Original Document
The Records list contains all records found for the patient currently being viewed. The Demographics, Summary, Codes, and Original Document refer to the current record selected in the Records list. The following sections detail the information provided in each section.
Customize the View
Each section on the Patients tab can be resized by clicking and dragging the blue thin arrows, or collapsed by clicking the blue circles.
 Click to zoom
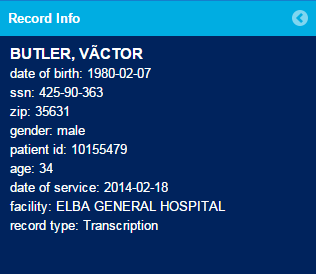
Demographics
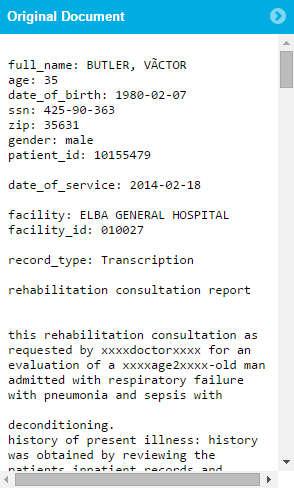
The Demographics section summarizes all demographic information found in a specific patient record. This information is updated to match the record currently selected in the records list. The Demographics section may include items like age, date of birth, social security number, gender, and date of service.
 Click to zoom
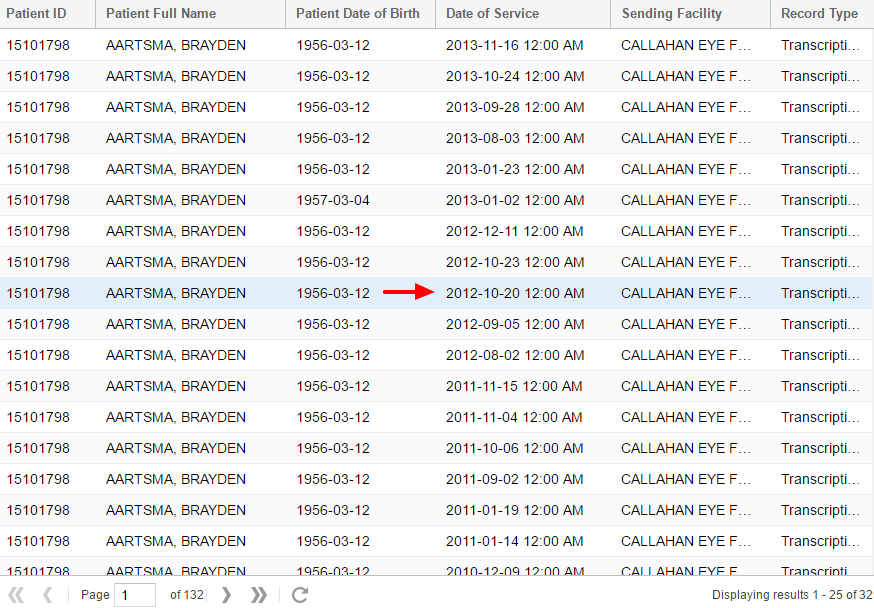
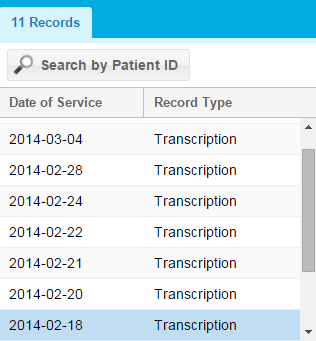
Records
The Record list in the bottom left corner contains all records found for the current patient. The Date of Service and Record Type columns are displayed by default.
Viewing Records
To view a record displayed in the records list, click on the record to select it. All the sections update to reflect information from the selected record.
Search by Patient ID
The Search by Patient ID button runs a new search on the patient ID on the single query panel and opens the Search tab. Once on the single search tab to further customize the report with additional search criteria to find specific patient records.
 Click to zoom
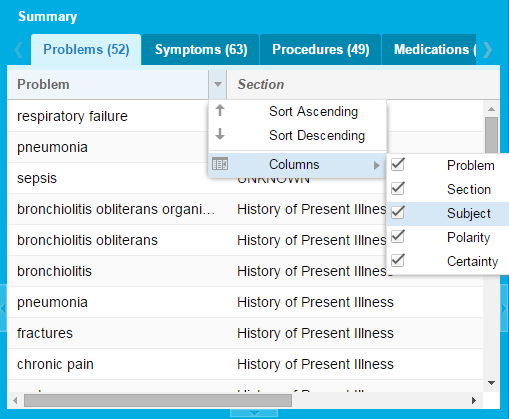
Add and Remove Columns
More information can be displayed by selecting the column header option drop-down menu. For example, use the steps below to add the facility:
- Click on the drop-down arrow revealed by hovering over the right side of the Date of Service column header.
- Select Columns.
- Click the check box to the left of Facility in the list of available fields.
To remove a column, follow the same steps as outlined above, but instead of checking the check box to the left of the column, simply uncheck it.
Sort the Records
The Records list can be sorted by any of the columns currently displayed:
- Click on the drop-down arrow revealed by hovering over the right side of the column header to be sorted.
- Select Sort Ascending or Sort Descending.
 Click to zoom
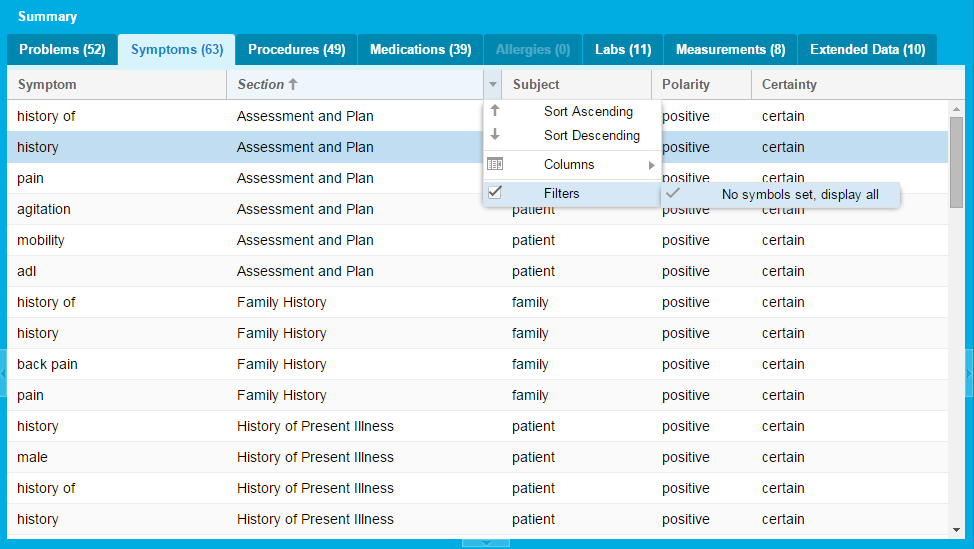
Summary
The summary section is located in the middle of the patient view and consists of tabs that provide summaries for the following concept categories:
- Problems
- Symptoms
- Procedures
- Medications
- Labs
- Measurements
- Allergies
- Extended Data
The number of records under the category is displayed next to the category name.
Each summary tab contains rows of clinical concepts extracted from the original document. The rows can be selected, which will display the SNOMED or RxNorm codes for that concept. The row selection will also highlight the concept text in the Original Document in the right panel.
An arrow appears over each column when the mouse is hovered over the column heading. From this menu, sort the column by ascending or descending order and select which columns are displayed.
Under the section heading, there is an additional option to filter symbol sets out. By choosing the filter option, if symbols are assigned to some categories, those records are filtered out of the records displayed in the summary. However, those records are still part of the count found next to the category name.
 Click to zoom
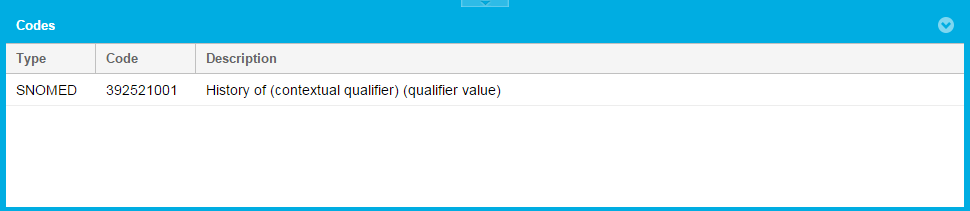
Codes
The grid beneath the Summary section displays codes associated with the selected summary concept. Problem, Symptom, or Procedure concepts will display SNOMED values, while Medication concepts will display RXNORM values.
 Click to zoom
Original Document
The Original Document section displays the original document so that concepts can be viewed in the context of the patient visit. Select a concept from a summary tab to see the text highlighted in the original document.
 Click to zoom
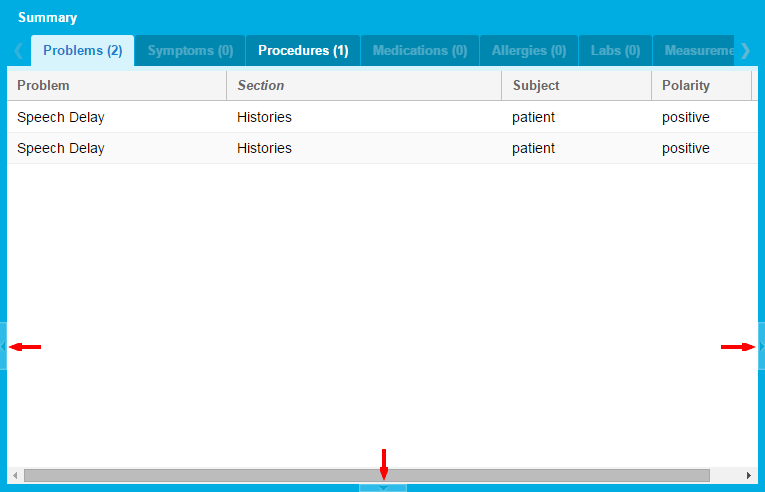
Hide Panels
Throughout Clinical Reports small blue arrows can be found around certain panes. These enable the user to collapse a panel, allowing for larger viewing areas of charts, result lists or summaries. To expand the view that was collapsed, click the arrow again.